Most Popular Job Openings in Indiana
Even in tough economic times, there is a regular stream of job openings through worker turnover, seasonal hiring and new job creation.
In the past year, office and administrative support jobs and production occupations have seen the most job openings statewide. Such information is published each quarter by the Indiana Department of Workforce Development (DWD) in its Job Postings and Starting Wages Report, which is based on employer-provided data submitted through DWD’s Indiana Career Connect (ICC) job matching service. This article focuses on job openings listed on ICC from October 1, 2009 to September 30, 2010.
Approximately 78,600 job openings were listed with DWD between the third quarter of 2009 and the third quarter of 2010 (see Table 1). Office and administrative support jobs ranked first with nearly 20,900 openings, followed by production jobs at just under 11,000. The top job in the office and administrative support category—interviewers—accounted for 32 percent of that category’s openings, but these were mostly temporary positions related to Census 2010.
Table 1: Job Openings by Occupation Category, October 1, 2009 to September 30, 2010
| Major Occupation Category | Total Openings | Percent of Total |
|---|---|---|
| Office and Administrative Support | 20,878 | 26.6% |
| Production | 10,976 | 14.0 |
| Transportation and Material Moving | 9,691 | 12.3 |
| Sales and Related | 8,996 | 11.4 |
| Building and Grounds Cleaning and Maintenance | 6,586 | 8.4 |
| Installation, Maintenance and Repair | 2,786 | 3.5 |
| Management | 2,696 | 3.4 |
| Food Preparation and Serving | 2,241 | 2.9 |
| Personal Care and Service | 2,206 | 2.8 |
| Business and Financial Operations | 2,136 | 2.7 |
| Construction and Extraction | 1,625 | 2.1 |
| Health Care Practitioner and Technical | 1,466 | 1.9 |
| Health Care Support | 1,232 | 1.6 |
| Protective Service | 958 | 1.2 |
| Computer and Mathematical | 884 | 1.1 |
| Arts, Design, Entertainment, Sports and Media | 848 | 1.1 |
| Architecture and Engineering | 675 | 0.9 |
| Education, Training and Library | 619 | 0.8 |
| Community and Social Service | 565 | 0.7 |
| Life, Physical and Social Science | 292 | 0.4 |
| Farming, Fishing and Forestry | 207 | 0.3 |
| Legal | 58 | 0.1 |
| Military | 6 | 0.0 |
| Grand Total | 78,627 | 100.0 |
Source: IBRC, using Indiana Department of Workforce Development data
Most Popular Postings
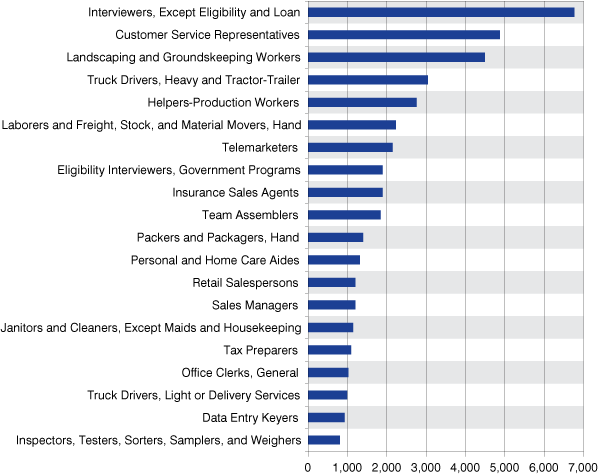
Figure 1 shows the 20 occupations that experienced the most openings over the year. Five were in the office and administrative support category, while four were in transportation and material moving.
Figure 1: Specific Occupations with the Most Job Postings, October 1, 2009 to September 30, 2010

Source: IBRC, using Indiana Department of Workforce Development data
Table 2 shows the most popular job in each of the 23 categories with its average hourly wage rate. Because this data set looks simply at total openings, occupations with seasonal hiring patterns often top the list (such as landscaping workers and tax preparers).
Table 2: Most Popular Occupation Posting for Each Major Category, October 1, 2009 to September 30, 2010
| Category | Top Occupation | Total Openings | Average Hourly Rate |
|---|---|---|---|
| Office and Administrative Support | Interviewers, Except Eligibility and Loan | 6,766 | $12.44 |
| Building and Grounds Cleaning and Maintenance | Landscaping and Groundskeeping Workers | 4,493 | 9.54 |
| Transportation and Material Moving | Truck Drivers, Heavy and Tractor-Trailer | 3,042 | 18.46 |
| Production | Helpers-Production Workers | 2,755 | 10.27 |
| Sales and Related | Telemarketers | 2,144 | 12.78 |
| Personal Care and Service | Personal and Home Care Aides | 1,312 | 8.97 |
| Management | Sales Managers | 1,200 | 23.82 |
| Business and Financial Operations | Tax Preparers | 1,093 | 12.16 |
| Protective Service | Security Guards | 734 | 9.45 |
| Construction and Extraction | Construction Laborers | 628 | 11.51 |
| Health Care Support | Nursing Aides, Orderlies, and Attendants | 609 | 10.63 |
| Installation, Maintenance and Repair | Maintenance and Repair Workers, General | 593 | 13.78 |
| Health Care Practitioner and Technical | Registered Nurses | 540 | 24.52 |
| Arts, Design, Entertainment, Sports and Media | Public Relations Specialists | 522 | 19.07 |
| Food Preparation and Serving | Food Preparation Workers | 434 | 8.26 |
| Community and Social Service | Social and Human Service Assistants | 328 | 11.22 |
| Computer and Mathematical | Computer Support Specialists | 213 | 16.85 |
| Education, Training and Library | Preschool Teachers, Except Special Education | 159 | 11.50 |
| Farming, Fishing and Forestry | General Farmworkers | 124 | 9.42 |
| Architecture and Engineering | Mechanical Engineers | 120 | 31.11 |
| Life, Physical and Social Science | Survey Researchers | 74 | 25.49 |
| Legal | Paralegals and Legal Assistants | 28 | 14.54 |
| Military | Air Crew Officers | 3 | 37.68 |
Source: IBRC, using Indiana Department of Workforce Development data
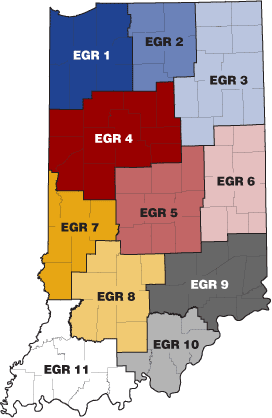
Figure 2 shows the most common job postings by economic growth region (EGR), highlighting the unique nature of each region, as well as the occupations that are commonly posted throughout the state.
Figure 2: Top 3 Occupations Posted by Economic Growth Region, October 1, 2009 to September 30, 2010
| Region | Occupation, Total Openings | |
|---|---|---|
| EGR 1 |
|
|
| EGR 2 |
|
|
| EGR 3 |
|
|
| EGR 4 |
|
|
| EGR 5 |
|
|
| EGR 6 |
|
|
| EGR 7 |
|
|
| EGR 8 |
|
|
| EGR 9 |
|
|
| EGR 10 |
|
|
| EGR 11 |
|
|

Source: IBRC, using Indiana Department of Workforce Development data
Summary
The quarterly Job Postings and Starting Wages Report is available via the Publication Lookup Tool on the Hoosiers by the Numbers website. It is just one of the many tools provided to aid in understanding job opportunities in the state. Additional resources include the Hoosier Hot 50 jobs list, occupation projections and high-wage/high-demand occupation analysis. Find them all at Hoosiers by the Numbers (www.hoosierdata.in.gov), a service of the Indiana Department of Workforce Development and powered by ALMIS and STATS Indiana.
Rachel Justis
Geodemographic Analyst, Indiana Business Research Center, Indiana University Kelley School of Business
