Free Data for Our Small Towns, Townships, School Districts and Neighborhoods
Data is the backbone of business. Companies need data about the location of their business, the destination of their products or services, about their labor supply and availability of capital. They seek data on their competition and their consumers. Businesses are data hungry and have learned more efficient ways to locate and mine data.
Data is also the backbone of the nonprofit world, education and government. Many of us seek it through Google searches. And millions seek it from the U.S. Census Bureau, the federal agency tasked with collecting information about the residents of the United States, state by state and community by community. While this agency is perhaps best known for the questionnaire that hits our mailboxes every 10 years in April, it is already a major hit on the Internet because millions go there to grab statistics about industries or communities.
December 2010 was a major milestone in the world of community statistics with the release of the five-year estimates from the American Community Survey (ACS). These estimates, based on a sample collected between 2005 and 2009, provide even the smallest town in America with estimates of their population by age, by race or ethnic origin. It estimates the number of households, educational attainment and shows the differences in earnings between men and women.
Important Facts about These Five-Year Estimates:
- Released annually—that means we can start viewing trends as early as next year
- All geographies will now have ACS data available: all counties, cities, towns, townships, boroughs, parishes, school districts, census tracts and even block groups (although not as much data will be released for block groups in order to protect confidentiality)
- Provide characteristics such as education, language spoken at home, type of job (occupation), income levels, poverty status, housing values, utility costs and monthly mortgage burdens
- Will have “error” associated with them, so users must be cautious when using them
- These are not the 2010 census counts (conducted in April 2010)—they are a survey
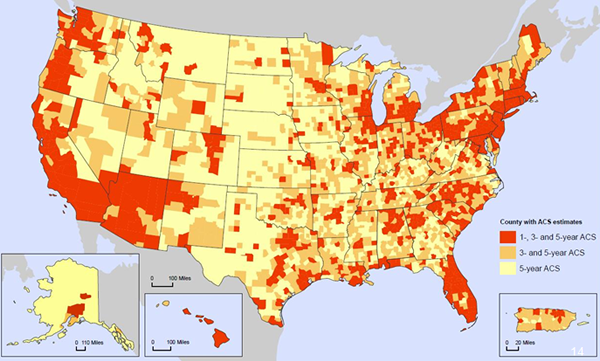
ACS estimates come in three release types depending on population size. Big places (65,000+) have one-year estimates; medium-sized places (20,000+) have three-year estimates, and small places (areas with less than 20,000 residents) result in five-year estimates. However, keep in mind the axiom about comparing apples to oranges: if you have to use the five-year estimates for at least one geographic area and then want to compare to a larger county, metro, the state or the nation, then use the five-year estimates for those larger geographies as well.
Figure 1 gives a good idea of which counties have all three types of estimates vs. just the five-year estimates.
Figure 1: American Community Survey Estimate Availability by County, 2010

Source: U.S. Census Bureau
Caveat Emptor
The ACS is a new data beast, so we should all proceed carefully as we begin to use this new information. Here is a short list of its pros and cons as delineated by the Census Bureau itself:
Strengths
- Reliable estimates of the characteristics of our population
- Does better with percents, rates, means and medians than the totals
Weaknesses
- Can’t mix one-year, three-year or five-year estimates for comparisons
- Not always comparable to Census 2000
- Margins of error for the five-year estimates about 1.7 times as large as Census 2000 error
- For aggregating geographies (say you want to use census tracts to build to a neighborhood) you need to do a calculation to know the margin of error (we provide access to an Excel-based tool on STATS Indiana)
Where to Access the Data
All the data for the nation will be available via the Census Bureau’s American FactFinder website. But STATS Indiana will also provide our users easy access to the most useful indicators as well as other helpful tools.
Carol O. Rogers
Deputy Director and Executive Editor, Indiana Business Research Center, Indiana University Kelley School of Business
