Indiana's Employment Dynamics
Employment change is one of the most basic and widely watched economic indicators. Particularly in tough economic times like these, regularly tracking job numbers is akin to taking the pulse of our economy. These net changes in employment do not provide a complete picture of our labor market, however. The usual employment numbers don’t tell us, for instance, that even during this past recession Hoosier businesses added 137,000 jobs per quarter. Unfortunately, these new hires were more than offset by 167,000 quarterly losses.
This article examines the U.S. Bureau of Labor Statistics’ (BLS) Business Employment Dynamics (BED) data to get a more in-depth look at Indiana’s job market. These data decompose business and employment change into several component parts that provide a view of the continuous establishment and job churn that fuels our economy. Later in the article, there is a particular focus on new establishment births and how Indiana stacks up in this area.
Inside the Numbers
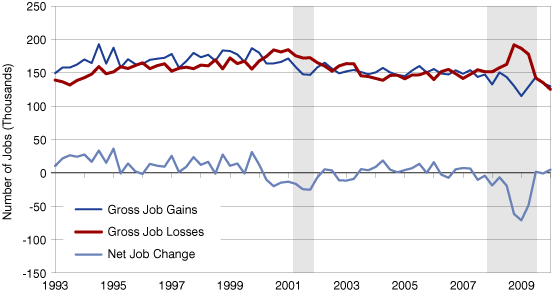
Indiana suffered significant private sector job losses through this most recent recession. As Figure 1 shows, unprecedented levels of gross job losses (combined with an equally stark decline in job gains) characterized this decline. The first quarter of 2009 marked the height of the recession in terms of the labor market for both Indiana and the United States. In this quarter, Indiana’s gross job losses represented 7.9 percent of the state’s total employment while gross job gains equaled just 4.9 percent. Over the same quarter, the U.S. had only slightly better marks at 7.8 percent and 5.3 percent, respectively. Fortunately, Indiana’s gross job losses have subsided to a point where the first quarter 2010 figure is the lowest on record, yet job gains remain weak.
Figure 1: Indiana Private Sector Gross Job Gains and Losses, 1993:1 to 2010:1
Note: Data are seasonally adjusted. Shaded area refers to U.S. recession periods.
Source: IBRC, using Bureau of Labor Statistics data
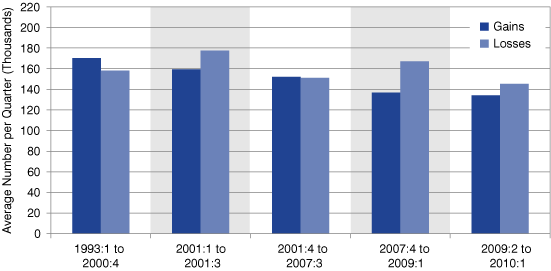
The BED data also show that while Indiana kept its head above water in terms of employment change between 2003 and 2007, the state’s employment dynamics recalibrated after the recession of the early 2000s. As Figure 2 illustrates, Indiana’s pace of gross job gains dropped from 170,000 per quarter before the 2001 recession to 152,000 during the period of growth that followed—an 11 percent decline. The United States saw a 6 percent drop in job gains per quarter between these same periods. Job losses in Indiana and the U.S. also adjusted downward but not as dramatically, which led to lower net employment growth between 2002 and 2007.
Figure 2: Indiana's Average Quarterly Private Sector Job Gains and Losses by Business Cycle
Note: Data are seasonally adjusted. Shaded area refers to U.S. recession periods.
Source: IBRC, using Bureau of Labor Statistics data
Not surprisingly, gross job gains declined even further after the onset of the most recent economic downturn. Although the U.S. has technically been in a period of recovery since mid-2009, significant employment gains have yet to be part of the rebound. At 134,000 jobs per quarter, Indiana’s average gross gains during this still young recovery are lower than they were through the recession. Time will tell whether we will see a return to pre-recession job gains or if this downturn will have a similar dampening effect on Indiana’s future employment dynamics.
Components of Employment Change
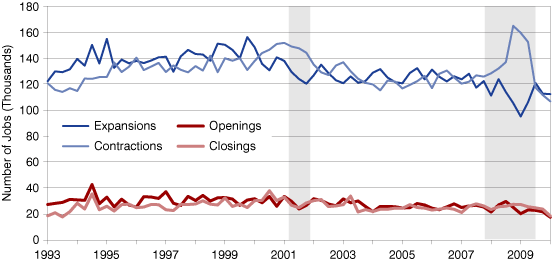
The majority of Indiana’s employment changes are the result of expansions or contractions of existing establishments. Since 1993, expansions have accounted for 82 percent of Indiana’s quarterly job gains on average while 83 percent of quarterly job losses result from establishment contractions. Given that changes at existing establishments drive these data, the trend in Indiana’s expansion- and contraction-based job gains largely mirror that of the gross job changes (see Figure 3).
Figure 3: Components of Indiana Private Sector Gross Job Gains and Losses, 1993:1 to 2010:1
Note: Data are seasonally adjusted. Shaded area refers to U.S. recession periods.
Source: IBRC, using Bureau of Labor Statistics data
The opening and closing of new establishments has a much smaller impact on employment change in a given quarter, but the process of establishment churn is important to the health of an economy. New establishments, in particular, are critical since they often spur innovation and are a source of future economic and employment growth. Over the entire course of this data series, Indiana’s quarterly job gains through openings have far surpassed losses from closings. Since the beginning of the most recent recession, however, closings have exceeded openings by 14,100 jobs in the state.
At this point, it is important to discuss the way BLS defines these terms. First, BLS reports these data at the establishment level rather than at the firm level. This means that an opening or a closing does not necessarily represent a new business but could be a single branch of a multi-establishment firm (e.g., General Motors or Starbucks). Therefore, these establishment data are not suitable for gauging entrepreneurship. Second, these data only cover establishments that have employees on payroll and do not include self-employed workers. Finally, BLS defines an opening as any establishment that did not have employees the previous quarter. This means that some seasonal establishments are counted as an opening and a closing each year.
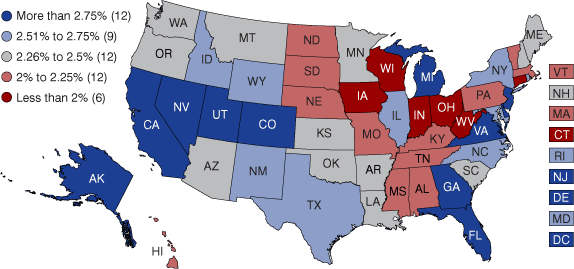
BLS overcomes this second issue by also producing data on births and deaths, which represent only establishments that have either not previously had employees or those that have closed permanently. Indiana has generally lagged the U.S. in the rate of establishment births. Figure 4 compares the recent establishment birth rates of all state’s and shows that Indiana has one of the lowest marks over the last four quarters.1 While it is true that the more recent data may not necessarily be representative of typical establishment birth rates, Indiana has rarely fared well in this measure. Dating back to 1993, Indiana has ranked among the top half of states in only five of 68 quarters and its average rank over this period is 38th.
Figure 4: Average Establishment Birth Rates by State, 2009:2 to 2010:1
Source: IBRC, using Bureau of Labor Statistics data
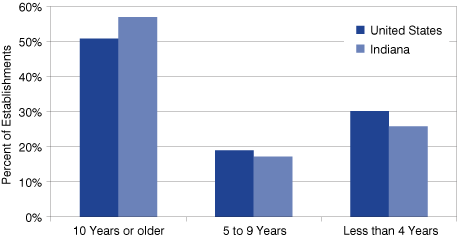
Indiana’s lower birth rates mean that the state’s economy is more reliant on established companies and traditional industries. As of the first quarter of 2010, 57 percent of Indiana’s establishments had been open for 10 years or more compared to 51 percent for the United States (see Figure 5). These older employers account for 77 percent of the state’s private sector jobs. Meanwhile, 26 percent of Indiana’s establishments have been open for four years or less but these younger employers contribute just 11 percent of the state’s jobs.
Figure 5: Private Sector Establishments by Age, Indiana and the United States, 2010
Source: IBRC, using Bureau of Labor Statistics data
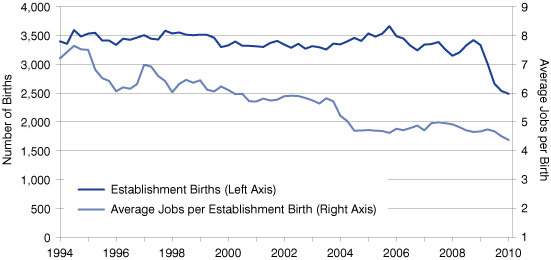
It is not surprising that younger establishments have fewer employees but an interesting trend seen in these data is that the average size of new establishments has declined consistently over the past 15 years. Figure 6 shows that the average number of jobs per birth in Indiana has dropped from greater than 7 in 1994 to around 4.5 in recent quarters. The number of employees per birth are even lower nationally. One likely reason for the decreasing size of new establishments is greater productivity brought on by new technologies. A 2008 analysis by BLS showed a correlation between the rise of its U.S. productivity index and the decline in the average size of new establishments.2
Figure 6: Indiana Establishment Births and Average Jobs per Birth, Four-Quarter Moving Average, 1994:1 to 2010:1
Note: Data are seasonally adjusted.
Source: IBRC, using Bureau of Labor Statistics data
New Establishment Survival Rates
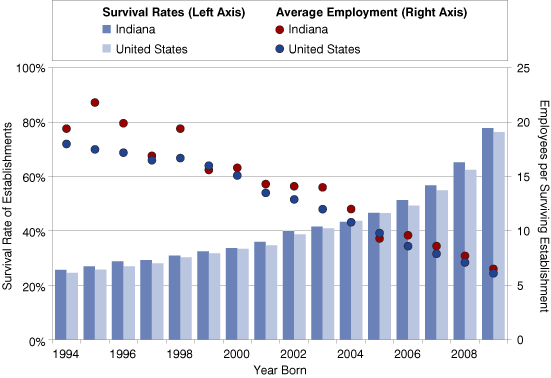
We have seen that Indiana tends to be less fertile ground for new establishment growth, yet the establishments that do crop up in the state generally have a better success rate. Figure 7 displays establishment survival rates as of the first quarter of 2010 by the year these employers opened as well as the average number of jobs in 2010 for each birth cohort. With the exception of 2004 and 2005, Indiana has a stronger survival rate in each cohort than does the nation as a whole. For example, 25.6 percent of Indiana’s establishments that opened in 1994 were still operating as of early 2010 compared to 24.6 percent nationally. The differences between Indiana and U.S. survival rates are most pronounced for establishments that opened 2006 and later.
Figure 7: Survival Rates of Private Sector Establishments by Year Born and Average Number of Employees at Surviving Establishments, 1994 to 2009
Note: Survival rates refer to establishments still in operation as of March 2010. Annual cohorts are defined as establishments that opened between April of the previous year and March of the year listed.
Source: IBRC, using Bureau of Labor Statistics data
We also see that though new employers do start small, successful establishments expand employment on average as they mature. Indiana typically has more employees per establishment than the U.S. and that gap tends to grow over time suggesting that state is somewhat more dependent on larger firms.
Conclusion
Although the U.S. economy is in the midst of a modest recovery, Indiana’s gross job gains remain well below pre-recession levels. We saw that Indiana’s gross employment figures reset to lower levels following the recession of the early 2000s. It is too early to know if we will see a similar trend in this next period of growth but these data give some reason for concern. Namely, Indiana’s economy is less dynamic than the nation as a whole. The state consistently lags the United States in the rate of establishment births and Indiana is more reliant on older and larger companies. Preserving Indiana’s position as a manufacturing leader will be important to maintaining our employer base, but a truly vibrant recovery will likely require that the state see expansion in new high-growth production and service industries.
Notes
- Establishment birth rates are calculated as births / total establishments.
- Akbar Sadeghi, “The Births and Deaths of Business Establishments in the United States,” Monthly Labor Review, December 2008, www.bls.gov/opub/mlr/2008/12/art1full.pdf.
Matt Kinghorn
State Demographer, Indiana Business Research Center, Indiana University Kelley School of Business
