More Than One Census
Upon hearing the word “census,” the decennial census, which concerns itself primarily with the characteristics of the nation’s residents, is likely what comes to mind. However, two other major censuses have recently released data: the Census of Agriculture and the Economic Census. Both of these censuses occur every five years, covering years ending in “2” and “7.”
The Census of Agriculture
Conducted by the U.S. Department of Agriculture, the 2007 Census of Agriculture covers all things farm and livestock related, providing the only source of uniform county-level agricultural data for the entire nation. Among other things, it looks at land use, ownership, operator characteristics, production practices, income and expenditures. Data and maps are available at http://www.agcensus.usda.gov/Publications/2007/.
The following are just a few Indiana highlights:
- With 60,938 farms, Indiana had a 1 percent increase in the number of farms since 2002, but a 2 percent decrease in the number of acres farmed. Indeed, the average farm size decreased slightly to 242 acres. However, it is worth noting that 33 percent of farms are much smaller, harvesting less than 50 acres.
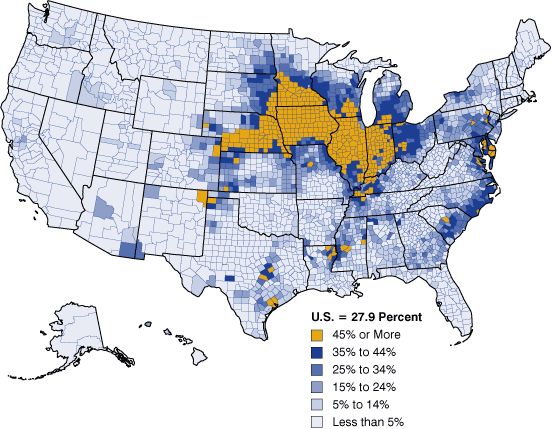
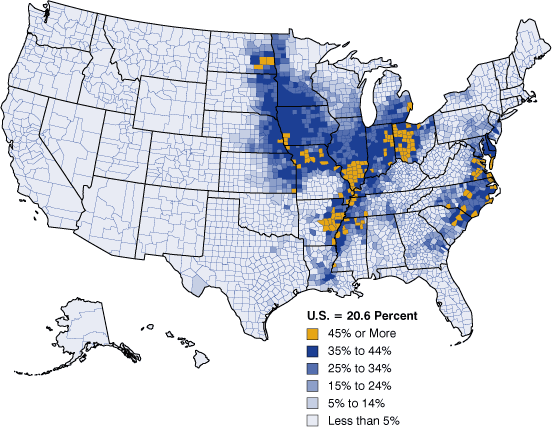
- Over half of the harvested cropland was devoted to corn, with soybeans accounting for an additional 40 percent. Figure 1 and Figure 2 show the county-level percentages for these crops nationwide.
- The state ranks third in the nation in the number of layers (i.e., chickens) raised, fourth in the number of acres devoted to soybeans and fifth in acres devoted to corn (see Table 1).
- In terms of dollar value, the grains, oilseeds, dry beans and dry peas category made up 61 percent of Indiana farm sales in 2007. Hogs and pigs ranked second at 12 percent, closely followed by the poultry and eggs category.
Figure 1: Acres of Corn Harvested for Grain as a Percent of Harvested Cropland Acreage, 2007

Source: 2007 Census of Agriculture
Figure 2: Acres of Soybeans Harvested for Beans as a Percent of Harvested Cropland Acreage, 2007

Source: 2007 Census of Agriculture
Table 1: Indiana's Livestock and Crops, 2007
| Top Livestock Inventory Items | Number of Animals | U.S. Rank | Universe |
| Layers | 24,238,513 | 3 | 50 |
| Pullets for laying flock replacement | 6,928,062 | 5 | 50 |
| Turkeys | 5,971,548 | 7 | 50 |
| Broilers and other meat-type chickens | 5,536,933 | 23 | 50 |
| Hogs and pigs | 3,669,057 | 5 | 50 |
| Top Crop Items | Number of Acres | U.S. Rank | Universe |
| Corn for grain | 6,362,576 | 5 | 49 |
| Soybeans for beans | 4,783,821 | 4 | 40 |
| Forage-land used for all hay and haylage, grass silage, and greenchop | 546,764 | 33 | 50 |
| Wheat for grain, all | 362,571 | 19 | 47 |
| Corn for silage | 105,937 | 17 | 48 |
Note: Universe is number of states in U.S. with item
Source: 2007 Census of Agriculture
The Economic Census
Conducted by the U.S. Census Bureau, the 2007 Economic Census collects detailed data on the economy by industry for a variety of geographies: national, states, metro areas, counties, places and ZIP codes.
The first set of data, the Core Business Statistics Advance Report, was released in March for the national level, showing preliminary data for sectors and industries. This release will be followed by more in-depth datasets throughout the remainder of 2009 all the way through late 2011. Data are released via American FactFinder at www.census.gov/programs-surveys/economic-census/guidance/finding-data.html
The following are some U.S. highlights from the 2007 Core Business Statistics Advance Report:
- Retail trade had the largest number of establishments, at 1.1 million.
- Health care and social assistance employed the largest number of people (nearly 16.9 million) followed by retail trade (see Table 2).
- Wholesale trade and manufacturing had the largest number of sales, each exceeding $5 trillion.
- Manufacturing had the largest numeric increase in sales ($1.4 trillion) since the 2002 Economic Census, while simultaneously experiencing the largest decline in employees in both numeric and percentage terms (see Table 3).
Table 2: National Economic Census Overview by Sector, 2007
| Sector | Number of Establishments | Sales, Shipments, Receipts, Revenue, or Business Done ($1,000) | Annual Payroll ($1,000) | Number of Paid Employees for Pay Period Including March 12 |
| Health Care and Social Assistance | 779,074 | 1,697,230,614 | 665,831,857 | 16,859,513 |
| Retail Trade | 1,122,703 | 3,932,027,444 | 364,991,713 | 15,610,710 |
| Manufacturing | 293,919 | 5,339,345,058 | 612,474,100 | 13,333,390 |
| Accommodation and Food Services | 626,558 | 612,949,468 | 169,845,677 | 11,587,814 |
| Administrative, Support and Waste Management | 381,599 | 629,304,120 | 290,546,420 | 10,153,833 |
| Professional, Scientific and Technical Services | 852,026 | 1,352,114,151 | 515,074,611 | 8,121,171 |
| Construction | 725,101 | 1,781,778,684 | 348,138,262 | 7,399,047 |
| Finance and Insurance | 503,156 | 3,641,082,600 | 494,484,693 | 6,562,546 |
| Wholesale Trade | 432,094 | 6,039,227,184 | 336,128,248 | 6,295,109 |
| Transportation and Warehousing* | 217,926 | 655,857,245 | 172,166,275 | 4,435,760 |
| Other Services (Except Public Administration) | 537,820 | 417,512,388 | 99,809,780 | 3,515,796 |
| Information | 141,034 | 1,075,153,974 | 223,376,793 | 3,428,262 |
| Real Estate, Rental and Leasing | 376,799 | 452,412,814 | 85,248,945 | 2,249,353 |
| Arts, Entertainment and Recreation | 123,965 | 188,975,642 | 57,545,590 | 2,070,524 |
| Mining | 21,169 | 369,191,012 | 37,308,193 | 703,129 |
| Utilities | 16,879 | 581,553,952 | 50,893,874 | 632,432 |
| Educational Services | 60,689 | 47,241,063 | 14,584,076 | 562,210 |
*Railroad transportation and U.S. postal service are out of scope for the 2007 Economic Census. Large certified air passenger carriers are included in the 2007 data, not included in the 2002 data, affecting comparability for this industry.
Note: Data for management of companies and enterprises were withheld because the estimate did not meet Census Bureau publication standards
Source: 2007 Economic Census
Table 3: U.S. Numeric and Percent Change by Sector, 2002 to 2007
| Number of establishments | Sales, shipments, receipts, revenue, or business done ($1,000) | Annual payroll ($1,000) | Number of paid employees for pay period including March 12 | |||||
| Sector | Numeric | Percent | Numeric | Percent | Numeric | Percent | Numeric | Percent |
| Manufacturing | -56,809 | -16% | 1,424,625,895 | 36% | 43,980,075 | 8% | -1,330,995 | -9% |
| Wholesale Trade | -3,427 | -1% | 1,404,472,072 | 30% | 76,475,168 | 29% | 416,704 | 7% |
| Retail Trade | 8,066 | 1% | 875,605,447 | 29% | 62,878,132 | 21% | 963,035 | 7% |
| Finance and Insurance | 62,888 | 14% | 837,227,732 | 30% | 116,694,521 | 31% | -16,271 | 0% |
| Construction | 14,792 | 2% | 573,045,132 | 47% | 93,836,950 | 37% | 205,818 | 3% |
| Health Care and Social Assistance | 74,548 | 11% | 489,930,880 | 41% | 169,986,028 | 34% | 1,807,258 | 12% |
| Professional, Scientific and Technical Services | 80,721 | 10% | 465,313,113 | 52% | 138,984,559 | 37% | 877,666 | 12% |
| Transportation and Warehousing* | 18,308 | 9% | 273,705,205 | 72% | 56,177,542 | 48% | 784,901 | 21% |
| Administrative, Support and Waste Management | 31,016 | 9% | 196,726,540 | 45% | 84,107,091 | 41% | 1,411,979 | 16% |
| Mining | -2,918 | -12% | 186,279,919 | 102% | 16,262,868 | 77% | 228,006 | 48% |
| Information | 3,356 | 2% | 183,308,018 | 21% | 28,706,630 | 15% | -307,799 | -8% |
| Utilities | -224 | -1% | 182,646,908 | 46% | 8,476,044 | 20% | -30,612 | -5% |
| Accommodation and Food Services | 60,968 | 11% | 163,450,750 | 36% | 42,291,194 | 33% | 1,466,863 | 14% |
| Real Estate, Rental and Leasing | 53,984 | 17% | 116,825,108 | 35% | 25,026,361 | 42% | 300,696 | 15% |
| Other Services (Except Public Administration) | 244 | 0% | 110,462,927 | 36% | 16,854,841 | 20% | 40,486 | 1% |
| Arts, Entertainment and Recreation | 13,652 | 12% | 47,071,533 | 33% | 12,376,473 | 27% | 221,850 | 12% |
| Educational Services | 11,370 | 23% | 16,550,356 | 54% | 4,419,698 | 43% | 132,046 | 31% |
*Railroad transportation and U.S. postal service are out of scope for the 2007 Economic Census. Large certified air passenger carriers are included in the 2007 data, not included in the 2002 data, affecting comparability for this industry.
Note: Data for management of companies and enterprises were withheld because the estimate did not meet Census Bureau publication standards
Source: 2007 Economic Census
Rachel Justis, Geodemographic Analyst
Indiana Business Research Center, Kelley School of Business, Indiana University
