Personal Income Growth Slows
One of the most closely watched indicators of our economic health is the change in personal income, which includes income individuals receive from all sources.
Data recently released by the U.S. Bureau of Economic Analysis reveal that, while personal income continued growing in 2008, the rate of growth slowed to 3.89 percent in 2008 from 5.98 percent in 2007. The modest 2008 growth rate slightly exceeded the inflation rate (3.35 percent for personal consumption expenditures), a sign that individuals did not experience much income gain during the first full year of the current recessionary period.
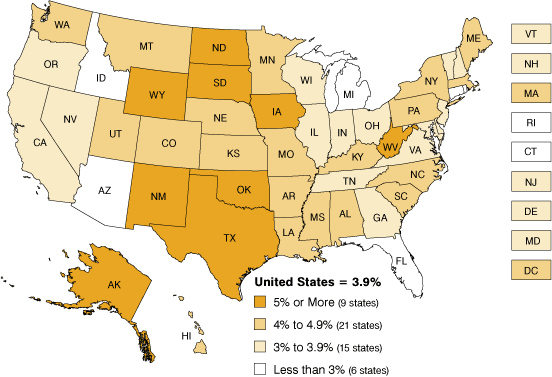
Indiana’s personal income grew by 3.34 percent, the 38th fastest rate in the nation and the state’s best ranking since 2003. This is about half a percentage point below the nation’s rate but better than the Great Lakes region’s 3.23 percent growth. As has been true since 2004, the Great Lakes region lagged all other regions in income growth. Michigan and Ohio ranked last in the nation at 51st and 44th, respectively, while Wisconsin placed just ahead of Indiana at 37th. Illinois’ 3.98 percent growth ranked 31st. Figure 1 depicts 2008 personal income growth for all states and the District of Columbia.
Figure 1: Personal Income Growth by State, 2007 to 2008

Source: IBRC, using Bureau of Economic Analysis data
How Much Income per Person?
One factor in the decades-long deficit Indiana experienced in personal income growth compared to the nation was the Hoosier State's slowly growing population. Faster-growing populations are naturally likelier to experience faster growth in total personal income (TPI). To control for differences in population growth and level the playing field among states, we look at per capita personal income (PCPI). Indiana’s PCPI in 2008 was $34,103, meaning that the average Hoosier received $5,648 less (in current dollars) than the average American.
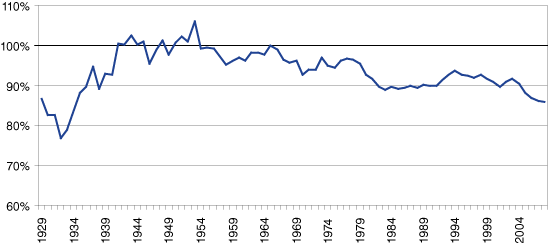
Figure 2 shows that for some brief periods, Indiana’s PCPI has equaled or exceeded the nation’s. This was the case during World War II when Indiana factories were busy cranking out goods for the war, and in the post-war era when factories refocused their energies on a long-deprived consumer market hungry for goods. Indiana’s prominence in manufacturing contributed to strong personal incomes in those days. The last time Indiana PCPI matched the nation was 1965. In the late 1960s and much of the 1970s, the gap was only a few percentage points, but the subsequent flight of production, workers and corporate headquarters to the Sun Belt led to a substantial decline in relative PCPI over the next several years. Nonetheless, Indiana PCPI persisted in the low-90 percent range relative to the United States until around the bottom of the last economic cycle in 2003-2004, when companies sought to cut costs through productivity gains and outsourcing. This led to the current trend of steady widening of the gap between Indiana and U.S. PCPI.
Figure 2: Indiana PCPI as a Percent of the United States, 1929 to 2008

Source: IBRC, using Bureau of Economic Analysis data
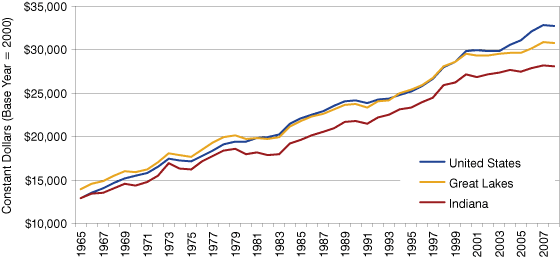
Figure 3 portrays these trends since 1965 for Indiana, the Great Lakes region, and the nation in real (inflation-adjusted) terms. Until the last several years, the region’s real personal income has grown at about the same rate as the nation’s, while Indiana’s has grown more slowly. For the past decade, however, the region and state have followed nearly parallel paths, while stronger growth in other parts of the nation kept the U.S. PCPI growing. In 2008, PCPI actually decreased in real terms for all three areas.
Figure 3: Real PCPI in Indiana, the Great Lakes and the United States, 1965 to 2008

Source: IBRC, using Bureau of Economic Analysis data
Components of Growth in Personal Income
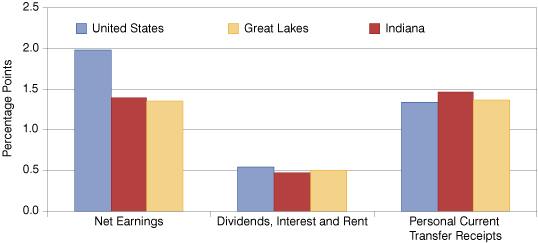
Personal income includes three main elements: earnings from working; investments (dividends, interest and rents received); and transfer receipts (government payments to individuals not for labor, such as Social Security, welfare, unemployment and veterans’ benefits, Medicare and Medicaid, etc.). The contribution of each to Indiana’s lagging growth between 2007 and 2008 is illustrated in Figure 4.
Figure 4: Contributions to Percent Change in Personal Income, 2007 to 2008

Source: IBRC, using Bureau of Economic Analysis data
Immediately apparent is the sizable disparity between the United States and Indiana or the Great Lakes in the contribution of net earnings to personal income growth from 2007 to 2008. Earnings accounted for more than half of the total growth in personal income nationally, but only about two-fifths of total growth in the state and region. A closer examination of the data reveals that wage and salary disbursements account for the majority of this disparity, adding around 1 percentage point to income growth in Indiana and the Great Lakes, but 1.6 points for the nation as a whole. Proprietors’ income, interestingly, contributed notably more (0.29 percentage points) to income growth in Indiana than in the Great Lakes (0.23) or the United States (0.22).
The relative contribution of investments to personal income was about the same across the three areas, adding about half a percentage point to income growth. Growth in transfer receipts contributed slightly more (1.47 percentage points) to the personal income growth in Indiana than in the region (1.37 points) or the nation (1.34 points). In fact, growth in transfer receipts surpassed earnings as a source of personal income growth in both Indiana and the Great Lakes region. State unemployment insurance benefits accounted for 7.5 percent of total personal income growth in Indiana vs. 6.5 percent in the Great Lakes and 4.4 percent in the nation. This may reflect Indiana’s relatively high limit on weekly benefits compared to other states, coupled with a rapidly increasing demand for benefits led by major layoffs in the manufacturing sector.
Jerry Conover, Ph.D., Director
Indiana Business Research Center, Kelley School of Business, Indiana University
