Inside the Data Center
Farmers Markets Open
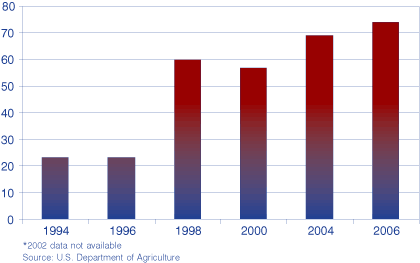
Chances are there is a farmers market near you. If not, wait a few years. According to the U.S. Department of Agriculture's Agricultural Marketing Service, the number of farmers markets in the United States has grown 110 percent since 1994. The National Directory of Farmers Markets, online at www.ams.usda.gov/farmersmarkets/map.htm, contains nearly 3,700 listings, up from 1,755 in 1994. Indiana has seen an increase of 222 percent over the same time period. The Department of Agriculture states that the growth is due mainly to the growing consumer interest in fresh produce direct from the farm (see Figure 1).
Figure 1: Indiana Farmer Markets, 1994 to 2006*

A recent article in the Indianapolis Star discusses the possibility of the Indianapolis Original Farmers Market staying open year round rather than just May through October. The City Market, which hosts the Original Farmers Market, commissioned a local marketing firm to survey Indianapolis residents on what they most wanted to see at the City Market. A year-round Farmers Market topped the list.
In June 2005, the Plymouth Chamber of Commerce opened a Farmers Market, which grew to have as many as 27 vendors over the summer. At $10 a day for a space, local farmers were able to sell their produce without spending money on gas to haul everything to markets further away.
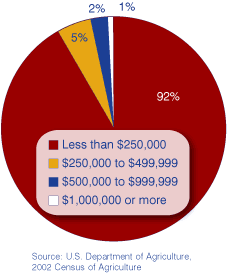
According to the U.S. Department of Agriculture, Farmers Markets benefit small farm operators, those with less than $250,000 in annual receipts, by giving them direct access to markets in order to supplement farm income. In the United States, 94 percent of all farms meet this definition. In Indiana, the number is slightly less but still above 90 percent. The 2002 Census of Agriculture counted a total of 60,296 farms in Indiana. Small farms accounted for 55,294, or 92 percent of Indiana farms (see Figure 2).
Figure 2: Percent of Total Farms by Market Value of Items Sold, 2002

For more information on Farmers Markets and U-Pick Farms, visit the U.S. Department of Agriculture at www.ams.usda.gov/farmersmarkets and the Indiana State Department of Agriculture at www.in.gov/isda/market/index.html.
Indiana Switches from Net In- to Out-Migration
The Census report Domestic Net Migration in the United States: 2000
to 2004, published in April 2006, shows that Indiana, along with Minnesota,
Mississippi, Oklahoma and Utah, have switched from net in-migration states
in the 1990s to net out-migration states from 2000–2004. The Census
Bureau defines migration as a move that crosses jurisdictional boundaries,
such as counties, states and countries. Net migration is the difference
between in‑migration (movement into an area) and out-migration
(movement out of an area) during a specified period of time.
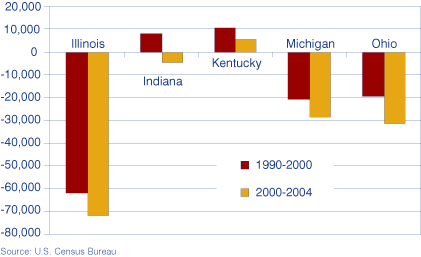
Between 1990 and 2000, Indiana had a net migration of 78,783 people,
or an average of 7,878 per year (see Figure 3). Since
2000, Indiana has had a net migration of -19,030, or an average of -4,758
per year.
Figure 3: Average Annual Domestic Migration

For more information, see the full report at https://www.census.gov/content/dam/Census/library/publications/2006/demo/p25-1135.pdf.
Frank Wilmot, State Data
Center Coordinator
Indiana State Library
