Scamming Hoosiers: Consumer Fraud on the Rise
In 2005, the Federal Trade Commission (FTC) received over 685,000 consumer fraud or identity theft complaints, bringing in losses of more than $680 million. Of all complaints, the majority (63 percent) were consumer fraud.
Consumer fraud rose 6.1 percent nationwide between 2004 and 2005 (only Vermont, Arizona and New Mexico reported less fraud in 2005). It grew significantly faster in Indiana, which unfortunately ranked third in the nation with a 33.5 percent increase in consumer fraud between 2004 and 2005. Only Alaska and South Carolina ranked higher.
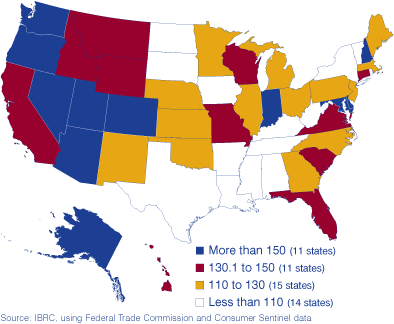
In 2005, Alaska had the highest rate of fraud, with 249.2 complaints per 100,000 population, and California led the nation in the actual number (48,707) of complaints (see Figure 1). At the other end of the spectrum, Mississippi had the least (per 100,000 population) at 72.4 and North Dakota had the fewest actual number of complaints with 632.
Figure 1: Fraud Complaints per 100,000 Population, 2005
Indiana ranked 10th in the nation for complaints per 100,000 population (152.6) and 15th in the actual number (9,572) of consumer complaints in 2005. Compare this to 2004, when Indiana ranked 23rd in complaints per 100,000 population (114.9) and 16th in the number (7,168) of complaints.
Within the Midwest, Indiana had the most complaints per 100,000 population. Wisconsin had the next highest rate (130.3) and Kentucky had the lowest rate (99.4).
Looking at metropolitan areas, Indianapolis ranked 11th in the nation in 2005 (2,692 complaints, 168.7 per 100,000 population), up from its ranking in 2004 of 15th (2,150 complaints and 141.0 per 100,000 population).
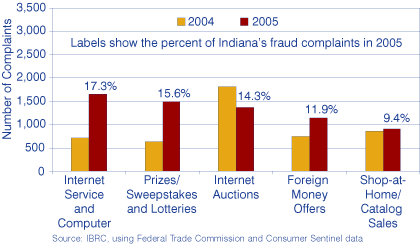
What types of complaints did Hoosiers file? In 2005, Internet services and computer complaints topped the list of the top fraud categories with 1,656 complaints, a staggering 132.9 percent increase from its fourth place status in 2004 (when there were 711 complaints). Next in line was prize sweepstakes and lotteries, which grew slightly faster (133.9 percent) than the number one spot, but only made up 15.6 percent of the total (see Figure 2). Surprisingly, Internet auctions (ranked first in 2004) actually decreased 24.4 percent, which equates to 441 fewer complaints than in 2004.
Figure 2: Top Five Fraud Complaint Categories for Indiana Consumers

Joan Ketcham, Database Technician
Indiana Business
Research Center, Kelley School of Business, Indiana University

