Immigration in Indiana
Immigration reform has entered the national spotlight again. As Hoosiers, what do we know about the immigrants who live and work in our state?
The bulk of this article focuses on the foreign-born population living in Indiana using data from the 2004 American Community Survey. The Census Bureau uses this term to refer to anyone who is not a U.S. citizen at birth and includes naturalized U.S. citizens, lawful permanent residents (those with green cards), temporary migrants (such as students), refugees, as well as those illegally present in the United States. It does not include children of immigrants born on U.S. soil since those children are natives (and citizens) by definition.
How Many?
Four percent of Indiana residents (that's about 237,500 people) were born outside the United States. Of that foreign-born population, 31 percent are naturalized U.S. citizens (73,787 people). Meanwhile, 34 percent of Indiana's foreign-born population (or nearly 80,000 people) have entered the country in the past five years. These most recent immigrants are more likely to be male than female.
Illegal Immigrants
Estimating the number of people here without a green card is tough for the simple reason that people in this country illegally don't generally go around broadcasting that fact by filling out government surveys. However, the U.S. Citizenship and Immigration Services estimated that Indiana had about 45,000 illegal immigrants in 2000. This is about 0.7 percent of the total population, which is lower than the nationwide rate of 2.5 percent. At 3.5 percent, Illinois is the only state in the Midwest to surpass the U.S. rate and, in fact, it ranks fifth nationwide (see Figure 1).
Figure 1: Percent of Population Estimated to be Illegal Immigrants, 2000
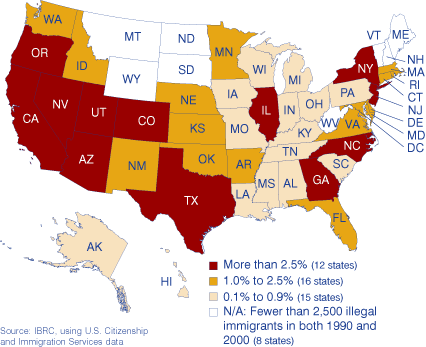
Other data from the Pew Hispanic Center (based on the March 2005 Current Population Survey) place the number of unauthorized immigrants living in Indiana between 55,000 and 85,000.
From Where?
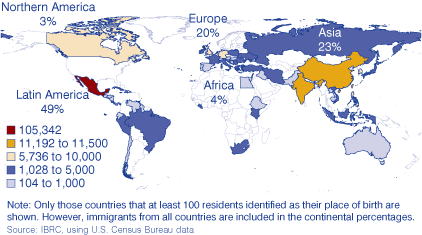
Almost half of the foreign-born population came from Latin America (see Figure 2). Indeed, over 105,000 people (or 44 percent of Indiana's immigrants) hail from Mexico alone. China, India, Germany and Korea round out the top five countries, with the number of immigrants ranging from 7,500 to 11,500.
Figure 2: Place of Birth for the Foreign-Born Population Living in Indiana, 2004
Educational Attainment
Using the population age 25 and older as the base, 28 percent of Indiana's foreign-born population has less than a high school education, compared to 15 percent of the native population (see Figure 3).
Figure 3: Indiana Educational Attainment by Citizenship, 2004
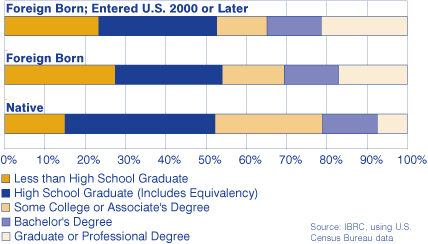
At the other end of the spectrum, a much higher percentage of immigrants have a graduate or professional degree (17 percent) than found in the native population (8 percent). Of the most recent immigrants (arriving in 2000 or later), 23 percent are not high school graduates, while 21 percent have a graduate or professional degree.
Jobs and Wages
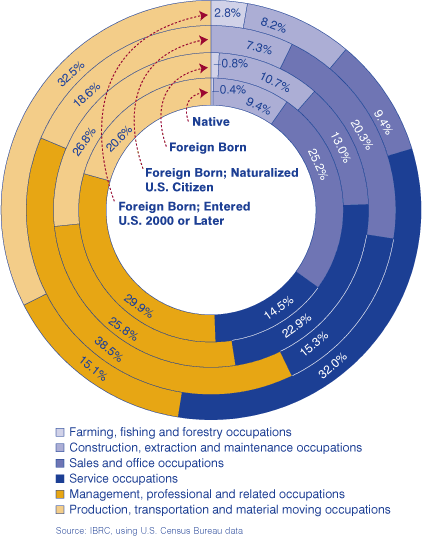
Of the working population age 16 and older, the manufacturing industry employs the largest percentage of both native (22 percent) and foreign-born (31 percent). Compared to natives, a larger percentage of the foreign-born workforce work in service occupations; production, transportation and material moving occupations; and construction, extraction and maintenance occupations. Figure 4 illustrates the vocational differences between these populations.
Figure 4: Occupations of Indiana's Native and Foreign-Born Population, 2004
Median earnings for the foreign-born (for full-time, year-round workers) are lower than for their native counterparts, with one exception. The median for a male naturalized citizen ($53,004) is higher than for a native man ($41,022). Overall, however, median earnings for a foreign-born male are just $28,891. At $23,335, foreign-born women earn about $4,600 less than native women. Recent immigrants face even lower wages, with annual median earnings of $21,828 for men and a mere $14,766 for women.
Habla Inglés?
Eighty-four percent of the foreign-born population age 5 and older speaks a language other than English at home. That percentage drops to 69 percent for naturalized U.S. citizens, but goes up to 90 percent for non-citizen immigrants. Spanish is the most common language spoken by the foreign-born population.
Nearly 222,000 Hoosiers (native and foreign-born alike) speak Spanish in their homes. Looking at just those who do not speak English at home, Spanish is the language of choice for 37 percent of the native population and 56 percent of the foreign-born population.
Of course, speaking Spanish at home does not necessarily imply this population doesn't speak English at all. In fact, 27 percent of the foreign-born population speaking another language at home say they speak English “very well.”
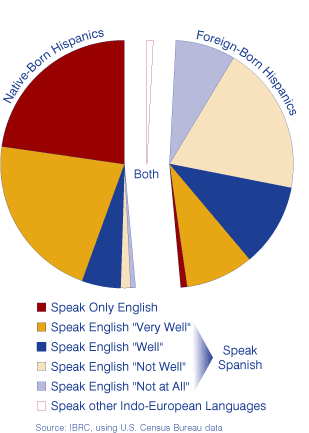
To hone in on English-speaking ability, let's look at Indiana's Hispanic population (see Figure 5). A little over half of the Hispanics in the state are natives and 44 percent of them speak only English. Of those who speak Spanish at home, about half say they can speak English “well” or “very well.” In contrast, 98 percent of the foreign-born Hispanics speak Spanish at home, with about 41 percent speaking English “well” or “very well.”
Figure 5: English Speaking Ability of Indiana's Hispanics, 2004
Rachel Justis, Managing Editor
Indiana Business Research
Center, Kelley School of Business, Indiana University
