A Look at Service Industry Job Gains in the Recession Years
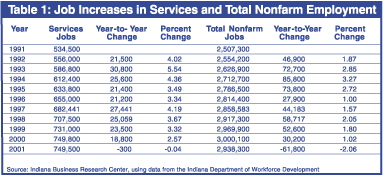
Indiana's services industries posted a significant net gain of 215,000 jobs between 1991 and 2001. These jobs, in a variety of sectors ranging from lawyers and architects to accountants and beauticians, accounted for just about half of the overall job gains in total non-farm employment during the same ten-year period.
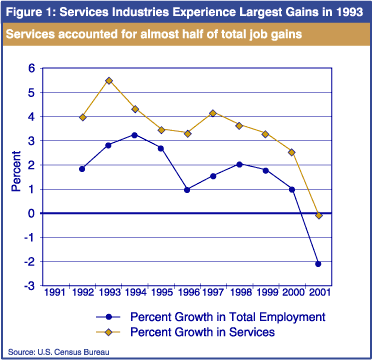
The peak in services job growth occurred between 1992 and 1993, with 30,800 new jobs. As Table 1 and Figure 1 show, these job gains began to decelerate by 2000, ending with a slight loss of 300 services jobs between 2000 and 2001, the year of our latest recession (see inset).


| A Chronology of Recent U.S. Recessions
Recessions begin with the peak and end with the trough The NBER does not define a recession in terms of two consecutive quarters of decline in real GNP. Rather, a recession is a period of significant decline in total output, income, employment and trade, usually lasting from six months to a year, and marked by widespread contractions in many sectors of the economy. A growth recession is a recurring period of slow growth in total output, income, employment and trade, usually lasting a year or more. A growth recession may encompass a recession, in which case the slowdown usually begins before the recession starts, but ends at about the same time. Slowdowns also may occur without recession, in which case the economy continues to grow, but at a pace significantly below its long-run growth. |
Largest Gains in Three Sectors
Eleven sectors comprise services under the SIC system (see article in this issue for information on the change to the NAICS system of categorizing industries). Service sectors with the largest job gains in Indiana between 1991 and 2001 included: business, health and amusement and recreation services. The following sectors created 170,700 jobs over the period of ten years.
- Business Services (SIC 73): 61,500 jobs-a 74% increase
- Health Services (SIC 80): 48,900 jobs-a 26% increase
- Amusement, Recreation (SIC 79): 23,700 jobs-a 121% increase
- Social Services (SIC 83): 18,400 jobs-a 48% increase
- Educational Services (SIC 82): 18,200 jobs-a 59% increase
| Services Industry Sectors Services Industry Sectors |
Metro Area Job Gains and Losses in Services
1992 to 2001
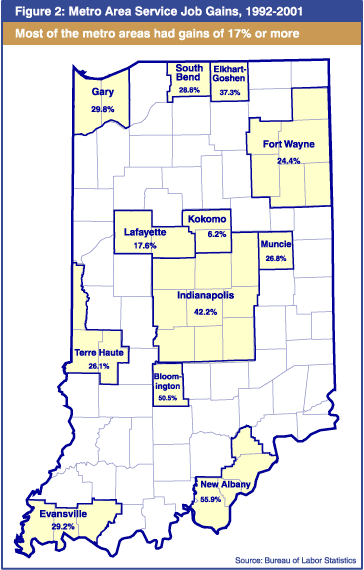
The twelve metro areas* in Indiana combined to add 155,000 services jobs between 1992 and 2001**. While the Indianapolis area added the most jobs, with 75,500, the New Albany area ranked first among the 12 in percentage growth, at 55.9%. Kokomo had the smallest growth (6.2%), adding a mere 500 jobs during this period. Most of the metro areas had gains of 17% or more (see Figure 2).

Mining for More
Much more can and should be done to mine these data for specifics on the services sectors that are driving growth or are on the decline. Two specific data series provide great quantities of detail. Current Employment Statistics is a monthly survey of a sampling of establishments. It is limited to state and metro area detail, but has the advantage of currency.
Indiana Industry Employment and Wages (aka Covered Employment and Wages) is essentially a count of business establishments and employment and is available at the state and county level on a quarterly basis, lagging by 3 or 4 quarters. Both of these series are available for viewing and downloading on STATS Indiana, a web service that provides these data as time series. For further information, go to www.stats.indiana.edu.
Notes
*Metro areas are metropolitan statistical areas, which are groupings of counties named for a central city.
**1992 was the earliest year available to us in electronic form at the time of this writing.
