The Shifting Costs of Education
As data from Census 2000 continue to be released, it becomes ever more apparent Indiana is not the homogeneous state we often assume we are. Demographic disparities have widened over the past two decades. A majority of our communities are older-in median age-than the rest of the U.S. Households are getting smaller and our population continues to shift from rural to urban.
We have mandated our school systems become visionary in respect to future educational needs and direction. So, as well as looking ahead, it is important for school districts to also look behind.
The number of children yet to enter the educational system and their associated demographics are a critical factor in long-term facilities and staffing planning. This is not an easy task and decisions made (or not) bear the potential of considerable expense to the state as a whole and the school district's taxpayers in particular. (Not to mention unexpected headaches for school board members and administrators caught unawares of sudden change!)
Over the past year the Indiana Business Research Center has completed a number of enrollment projections for school districts. All have borne out the fact that no two systems are quite alike. Each has its own dynamics incorporating the expected amount of new residential construction attracting new student households. Each has differences in the characteristics and ages of expected new community residents. Each community has a different attitude toward growth and means of communication (or lack thereof) between local planners and school administrators.
The Basis for Decision Making
Forecasting school enrollment demands analysis of not only the total number of students expected over time but distribution by grade level as well. The cost of new construction, remodeling or school grade configuration is highly dependent upon the pupils' ages and the number of years a facility is expected to be in use.
James Thompson of Indianapolis-based Gibraltar Design, a firm engaged in school architecture and construction, notes the costs of elementary/intermediate school construction will run from $90 to $120 per square foot. Middle schools/junior highs are more likely to be in the area of $100 to $130. High schools are yet another step to the $120 to $160 per foot range. As a rule of thumb, a school needs 1,000 square feet of space (including shared common areas such as halls and restrooms) for each classroom. Even a simple addition, then, becomes an expensive proposition-particularly if only to meet current rather than long-term need. According to Thompson, even simple school renovation costs a minimum of $20-30 per foot and "gut rehab" costs $75-100.
While remodeling and renovation do offer temporary savings compared to new construction, the facilities will often still have shortcomings. How well, for example, can an older building adapt as student demographics change? "There is a point of diminishing returns as renovation costs rise," says Thompson. "If enrollment forecast supports long-term use then, considering all factors, it may be cheaper to build if location isn't a chief priority."
The Three Patterns of Enrollment
From an enrollment perspective, there are three types of school districts:
- Growing enrollment districts: In these districts enrollment has grown over 10% during the past ten years-exceeding the rate of Indiana's total population growth-and expectations are that like growth will continue over the coming decade.
- Mature enrollment districts: These are characterized by minimal fluctuations in total enrollment-normally no more than 1% up or down per year-and anticipation of like numbers of students ten years out.
- Declining enrollment districts: These are characterized by decreases in the number of students in excess of 1% and the expectations of continued like enrollment shrinkage.
It should be pointed out all school districts move through a growth-to- maturity-to-decline scenario to some degree. For example, a mature district may be faced with declining enrollment if "empty-nesters" gain as a percentage of households while the district's new housing construction slows. But, as those empty-nesters begin moving away (replaced by younger households with children), or if there is a sudden surge in new residential construction, the cycle of growth may start all over again. On the other hand, a system with declining enrollment in a rural area, or one faced with a weakening local economy inhibiting residential stability, is likely to go through a prolonged slippage in student numbers.
Three Patterns of Enrollment Expense
Each of the three types of school systems faces unique financial challenges based upon enrollment. Growing districts typically have:
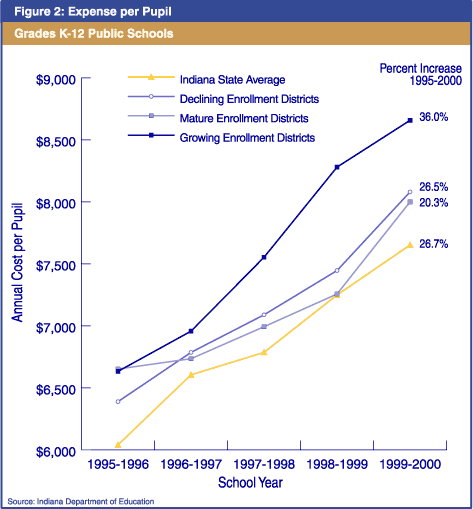
- A high expense per pupil fueled by the necessities of new facilities and continual purchase of buses, textbooks and equipment.
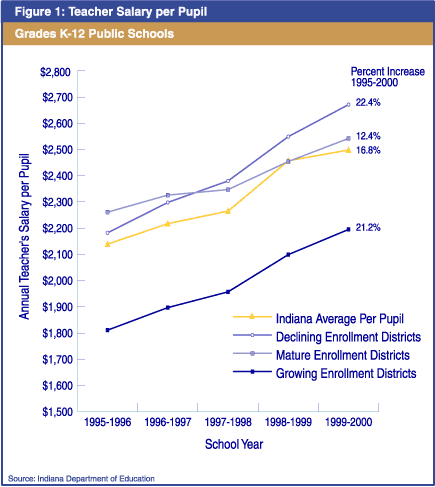
- Low teacher salaries coupled with high student/teacher ratios. For instance, Hamilton Southeastern Schools in Fishers (the state's fastest growing district) has an average teacher salary some $2,000 per year less than the state as a whole while having a student/teacher ratio of 21.6:1 versus the state's 16.7:1.
- A high proportion of students entering the district at the K-1 grade levels. As these waves of students progress through the system, they continue to shift demands to the middle school and high school level while altering later needs for elementary grades.
Gibraltar's Thompson suggests growing districts look at future adaptability when considering construction options. "Look at the enrollment projections by grade level. They may well justify the initial expense of planning for an elementary school that can later be converted to a middle school, or a middle school that can easily become a junior high. Or, certainly, the reverse."
Mature school districts are characterized by:
- Stable structure of expenditures compared to systems with fluctuating enrollments. While all schools are heavily weighted toward fixed versus variable costs, it is still easier for mature systems to match enrollment, capacity of facilities and expense of operations.
- High teacher salaries per pupil due to tenure and lack of staff turnover as well as moderate class sizes.
- New students entering the system fairly evenly through all grade levels.
Declining enrollment districts are notable for:
- Higher than average costs per pupil. The cost per pupil is often associated with excess capacity; it costs about the same to maintain a classroom of ten students as twenty-five or provide a bus to transport twenty students versus forty. Declining enrollment districts are also commonly associated with aging facilities requiring high degrees of maintenance.
- Higher teacher salaries per pupil. This is prompted not only by tenure and dwindling class sizes but, in some instances, by the need for competitive pay to attract and retain teachers in less desirable areas.
- Variable patterns of student grade entry level and departure.
Districts experiencing enrollment decline have not only the daunting task of efficient economic planning but also the test of dealing with highly charged community emotions attached to schools. At what point does a district close or "mothball" a school? Or even at what point does the district consider the (dreaded) thought of consolidation with another school system? These are of particular concern in areas where the schools might be the sole means of community identity.
When Marion County's Washington Township (North Central High School) experienced a rapid decline in enrollment from 15,000 to 10,000 during the mid-1970s to '80s (mostly attributable to the "empty-nester syndrome") administrators were able to trim their budget by closing four elementary schools. One site was sold for use as a private school, one was mothballed for alternative use, and two in prime residential areas sold for housing development. While such downsizing met some degree of neighborhood resistance, the closures did provide both cash inflow and savings through consolidation of services. Unfortunately, not all districts have the luxury of valuable real estate to sell or the resources to support retention for non-classroom purposes. For those, it makes the debate of facilities improvement, closure or alternate use all the more difficult. Accurate enrollment projections help support the decision-making process involving any of these scenarios.
Enrollment Costs by the Numbers
Figures 1 and 2 compare the expense per pupil from the school year 1995-96 through 1999-2000 and the teacher salary per pupil for the period 1995-96 through 1999-2000 for a random selection of growing, mature and declining enrollment schools.


Those comprising growing district peers are: Avon, Franklin, Hamilton Southeastern and Westfield-Washington Schools (Hamilton County).
Those comprising mature district peers are: Ft. Wayne, MSD of Washington Township (Marion County), South Harrison (Harrison County) and Northeast Schools (Sullivan County).
Those comprising declining enrollment peers are: Gary, Marion, Peru and White River Schools (Greene County).
As we put increasing emphasis upon education as a key to Indiana's future, it is imperative for economic efficiency that our school districts keep abreast of shifts and trends in student numbers and demographics. The average Hoosier school district has nearly 3,400 students. A 1% shift in enrollment equates to two classrooms of students-a $250,000 brick and mortar investment-and a like amount in annual support funding gained or lost. Accurate enrollment projections can facilitate accurate planning to the benefit of students, teachers, administrators and our taxpayers
