Indiana Tax Revenues for Expenditures Compared to Other States
Too often the purpose of taxes is overlooked. Simply stated, taxes, along with fees, licenses and other charges, generate revenue by which governments provide services to their citizens. Government services include everything from highways, police and fire protection, public education, sewers and parks to libraries, public hospitals, public health, public airports, veterans' services, corrections, protective inspection and regulation, solid waste management, unemployment insurance, debt payment on special tax districts and public welfare. This article will compare Indiana to other states and the national average in terms of total revenue collected and revenue expended by service category.
Finding accurate comparative data is difficult. Tax rates vary significantly between states and are often levied by different levels of state and local government. Furthermore, most taxes and charges are subject to numerous exemptions, credits, abatements and other aspects that alter the actual amount of funds collected. The U.S. Census Bureau, however, provides a comparable aggregate database in its annual report, State and Local Government Finances by Level of Government. This report provides data on the total revenues collected and revenue expenditures by functional area, such as education, roads or public safety. Since total revenues will vary greatly between states of different population sizes, a final step is needed to make the data comparable. For the purposes of this article, revenues collected and allocated are divided by the population for a standard measure of average revenues and expenditures per person.
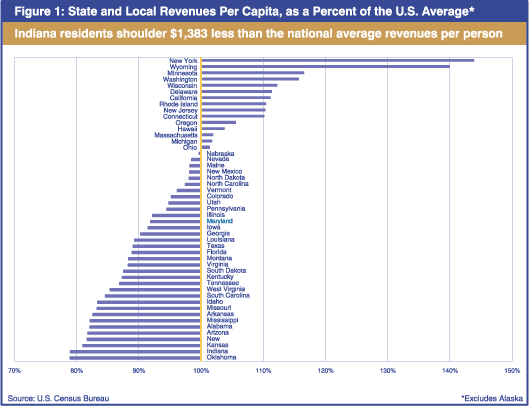
Indiana's state and local revenues were approximately $5,198 per person for the fiscal year 1998-1999. To understand the significance of this number, it must be compared to the per capita revenues of other states and to the U.S. average (note: Alaska figures are unique as they include special payments by oil companies). Indiana revenue collection per capita is lower than every other state with the single exception of Oklahoma (see Figure 1).

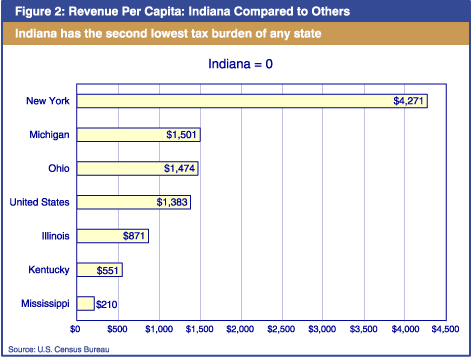
Indiana residents shoulder 21%, or $1,383, less than the national average revenue per person. New York residents provide about $4,271 more than the average Hoosier in revenues per person. Indiana's surrounding states also collect more revenue per person (see Figure 2). In a sense, total revenue collected can represent the unified tax burden per person for the state. By this definition, Indiana has the second lowest tax burden of any state.

The distribution of revenues across categories of service will also vary between states. Different areas of government will, by their nature, require higher expenditure of revenue than others. Maintaining transportation infrastructure and providing public education to all will require more money than running the public libraries or parks. Expenditures will also reflect the unique needs and priorities of different states. In most states, education receives the greatest revenue distribution with average expenditures in the U.S. equal to $1,772 per capita. In Indiana, education expenditures equal $1,799 per capita, approximately 35% of Indiana's total revenues collected. The balance pays for all other government services and obligations.
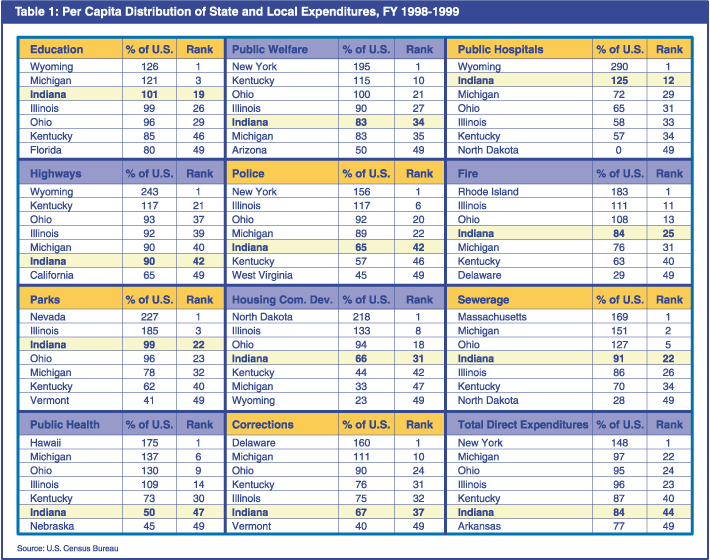
State per capita expenditures by category can be compared using an index based on average U.S. per capita expenditures. All values greater than 100.0 indicate that state expenditures are greater than the U.S. average while values less than 100.0 indicate expenditures lower than the national average. Table 1 compares Indiana to our neighboring states, and to the states with the highest and lowest index values. Also included is the state rank among all fifty states.
Indiana expenditures exceed the U.S. average in only two categories-education and public hospitals. Indiana expenditures on highways, police and public health are among the lowest in the nation. It should not be assumed however that a low rank automatically means insufficient funding of an item. Expenditure levels may be a function of demand for certain services as well as budget choices. For example, Indiana's low highway expenditures may be a function of lower traffic density, stronger surface types or fewer urban roads relative to other states.
Total direct expenditures in Indiana are 84% of the national average and the 44th lowest in the country. In dollar terms, it costs each Hoosier-from the newborn to the octogenarian-an average of $4,967 a year to support all the government services in Indiana. This is quite a deal when you consider that this includes an education for our children and future wage earners, roads to drive on, safe neighborhoods, clean drinking water, fire protection, libraries, open space and financial security should you lose your job.

