Indiana's August Employment Growth Followed Regional Trend
Indiana's employment growth for August mirrored the trend among most of its neighboring states. The Indiana Department of Workforce Development reported 2.98 million nonfarm jobs in the month, up 0.7% from August 1999.
This number represents the number of jobs located in Indiana - including jobs held by residents of other states who work in Indiana. It does not count Indiana residents who work outside Indiana.
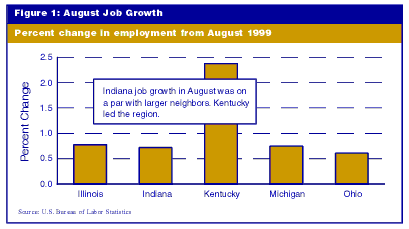
Jobs growth in Illinois, Michigan and Ohio was almost identical to Indiana's (see Figure 1). Kentucky led the region, though, with an increase of 2.4% over the year-earlier period. Kentucky's job growth has been consistently above 2% in every month this year.
The jobs numbers in Indiana, Illinois, Michigan and Ohio are starting to reflect the gradual easing of the growth rate in the general U.S. economy. Although employment continues to expand, the month-to-month increases were above 1% in the first three months of this year, but just under 1% in July and August.
When the U.S. Federal Reserve raises interest rates, often the first sectors of the economy to slow as a result are the sectors that manufacture items associated with major consumer purchases: automobiles, for example, or houses. Much of the manufacturing that takes place in Indiana, Illinois, Michigan and Ohio is associated with making cars or with making things that go into new homes.
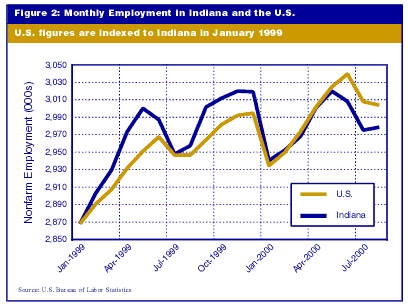
The effect in Indiana can be seen in Figure 2. The blue line shows monthly nonfarm employment in Indiana, not seasonally adjusted, starting in January 1999. The gold line tracks total U.S. nonfarm employment, indexed to the Indiana figure. Throughout 1999, monthly employment gains in Indiana generally exceeded the rate of increase in the nation, but declines were sharper in Indiana, too. Starting in the second quarter of 2000, however, Indiana's employment gains lagged those in the U.S. as a whole. Employment in Indiana experienced such strong growth in 1999 and early 2000 that August's jobs total still is higher than the 1999 average. But the effects of higher interest rates are showing up clearly in the most recent figures.
Coal-Mining Employment Steady in Indiana
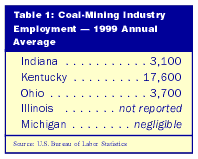
The coal-mining industry in Indiana employed 3,100 people in 1999, according to data recently released by the U.S. Bureau of Labor Statistics. Though this annual average is down slightly from 1998, coal jobs have held nearly steady in the state for five years.
Indiana has about the same number of coal-mining jobs as Ohio (see Table 1). Kentucky, where coal ranks as one of the state's major industries, has more than five times as many coal-mining jobs. Kentucky's coal employment has sunk dramatically since the early 1990s, but the industry still accounts for nearly 18,000 jobs. The Bureau of Labor Statistics did not release coal-mining employment in Illinois. In Michigan, Indiana's other neighbor, coal mining is virtually non-existent.
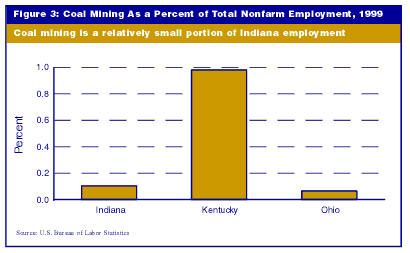
Compared to total state employment, coal mining comprises about one-tenth of 1% of all nonfarm employment in Indiana (see Figure 3), or about one in every 1,000 jobs. The percentage is similar in Ohio. In Kentucky, with many more jobs in coal mining but fewer total jobs, the proportion is far higher. Of all nonfarm jobs in Kentucky, about one in every 100 is found in coal mining.
Coal mining as a source of jobs across the nation has shrunk (see Figure 4). Coal's share of U.S. employment was 0.07% in 1999, according to the most recent data. That's only three-fourths of what its share was in 1995.
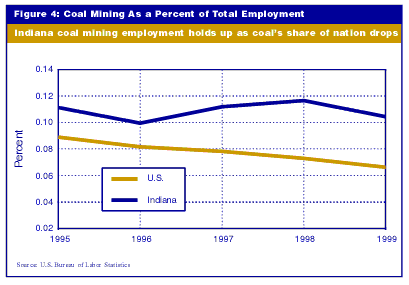
In Indiana, by contrast, coal industry employment in 1999 was 0.1% of state employment. Coal's share has remained in the same range throughout the same five-year period: a small but stable segment of Indiana's jobs picture
