Indiana Output Outpaces the Nation
The latest data for Gross State Product (GSP) indicate that Indiana's economy grew faster than the nation both in the most recent year measured (1997-98) and over the past decade (1988-98). GSP, as measured by the U.S. Bureau of Economic Analysis, is for the states what GDP is for the nation—a measure of the value of all goods and services produced within the state during a year.
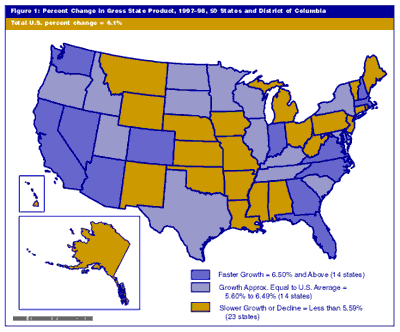
Indiana's GSP advanced by 6.5% in 1998 (14th in the nation), while the nation's grew by 6.1%. Washington state edged out Colorado for top honors in the nation at 9.4%, followed by Arizona, Georgia and New Hampshire (see Figure 1).
Click on map to see larger version.

Over the longer period, 1988 to 1998, Indiana's GSP grew by an average annual rate of 5.8% (21st in the nation) as the U.S. GDP rose 5.6%, led by Nevada and Utah*. During this period, Indiana continued to rank as the 15th-largest economy in the nation, although Washington state advanced over Indiana, Missouri and Maryland, from 17th to 14th place, and Maryland slipped behind Indiana to 16th place.
Top-Performing Sectors
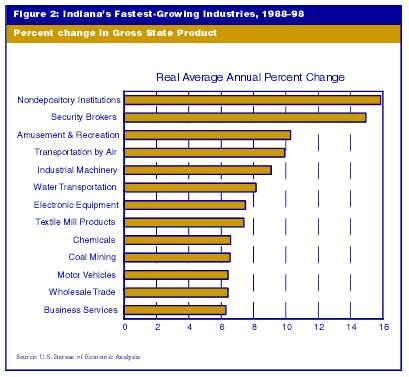
The industries that led Indiana's growth over the past decade are shown
in Figure 2. At the top of the list are non-depository institutions (mortgage
and other loan companies) and security brokers. With the remarkable advances
in the financial sector, this is no surprise. Yet in both of these sectors,
Indiana again outperformed the nation.
Riverboats made our amusements and recreation sector a top performer. In fact,
with the exception of electronic equipment, Indiana outperformed the nation
in each sector noted in Figure 2. The state's greatest advantage over the
nation during the past 10 years came in textile mill products (7.4% growth
in Indiana versus 1.1% in the nation) and in motor vehicle production (6.4%
versus 1.4%).

*These data are not adjusted for inflation and include the District of Columbia in the rankings.
Per Capita Personal Income Growth
Per capita personal income (PCPI) in Indiana rose to $26,143 in 1999, according to figures released by the U.S. Bureau of Economic Analysis. This was a 3.8% increase for the year, compared with a national growth rate of 4.5%. Massachusetts led the nation at 6.5%, while North Carolina realized only a 2.2% increase.
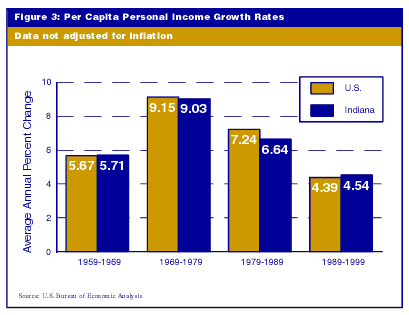
When viewed over the course of the past decade, PCPI in Indiana advanced faster than in the nation. This reverses a two-decade pattern in which Indiana trailed the nation in growth of PCPI (see Figure 3).

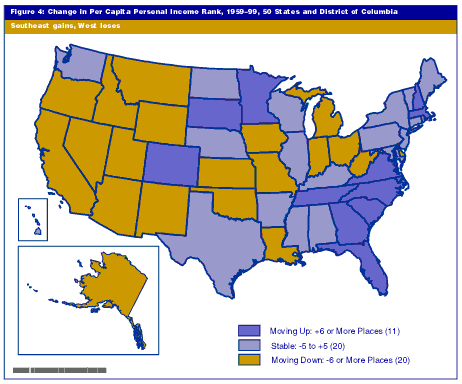
The economic and demographic changes of the past 40 years have vastly altered the PCPI rankings of states (see Figure 4).
Click on map to see larger version.

Indiana finds itself coupled with California and Ohio in moving down 12 places in the PCPI ranking (from 21st in 1959 to 33rd in 1999). All of Indiana's neighbors also fell in the rankings during this period: Kentucky moved down just one place from 43rd to 44th; Illinois fell from eighth to 10th; Ohio moved from 14th to 26th; Michigan went from 12th to 21st; and Wisconsin fell from 19th to 24th. The biggest gains were made by Virginia (19 places, from 36th to 17th) and Georgia (42nd to 25th). As a matter of national policy, these results should not be disturbing. The top eight gainers included only one state (Minnesota) that was in the top 25 in 1959. South Carolina was 50th and North Carolina 46th in 1959, and they advanced to 41st and 34th, respectively.
Several western states with fast population growth moved down dramatically in the rankings. (Increased numbers of children and retired persons tend to reduce PCPI.) In a similar fashion, slow population growth can lead to higher PCPI rankings (South Dakota rose from 47th to 39th).
