The Utility Industry in Indiana: Details from the Economic Census
Utilities are essential to the modern lifestyle. Most of us wouldn't want to live without lights, water, air conditioning, central heating, electric or gas cooking appliances, and indoor plumbing. We don't think too much about these necessities of living until we are suddenly without them—for example, during hot spells in summer or cold snaps in winter, when demand can sometimes exceed supply.
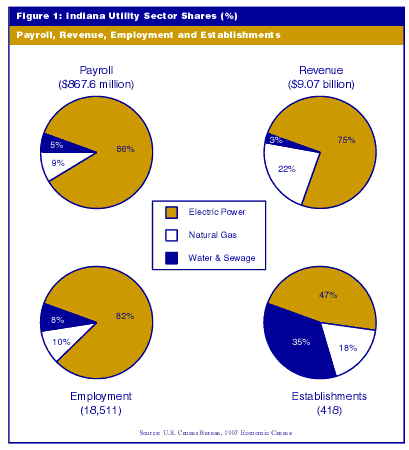
Most of us probably don't ponder the specifics of the utility industry outside of knowing which utility companies serve our needs at home or work. But the utility sector is a significant one in our economic structure, and we can learn about it through the most current Economic Census conducted (in 1997) by the Census Bureau. Details collected from the utility sector show there were 418 Indiana establishments engaged in the utility business, with revenues nearing $10 billion and employment of 18,511 (click here to see Table 1).
The utilities sector, a.k.a. NAICS* Sector 22, includes those establishments that provide electric power, natural gas, water supply and sewage removal. Utility revenues accounted for approximately 2.5% of all revenues, receipts, sales and value added (as calculated from the sectors in the economic census for Indiana).
Within the utility sector, specific activities vary by utility in Indiana. Electric power (NAICS code 2211) includes generation, transmission and distribution and is by far the largest industry in the utilities sector—with $6.8 billion in revenue and 15,202 employees. Natural gas (NAICS code 2212) includes distribution and accounted for $2 billion in revenue and 1,820 employees working in 76 establishments. Water supply and sewage services (NAICS code 2213) were provided through 147 establishments, employing 1,489 and generating revenue of $247 million.
Electric power generation, transmission and distribution accounted for 86% of the utility sector's payroll, 82% of the sector's employment, 75% of revenue and 47% of establishments (see Figure 1).
Electric power distribution is the largest component of the three six-digit-level industries that comprise the electric power sector: distribution, fossil fuel electric power generation and hydroelectric power generation (see Figure 2).
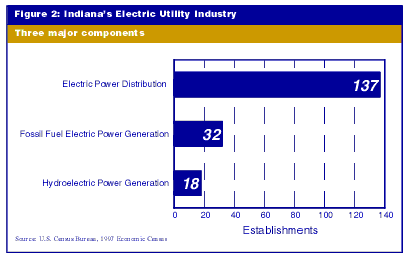
Electric power distribution accounted for 73% of the establishments (187 among these three six-digit industries) and generated $3.2 billion in revenue in 1997. The other two six-digit industries' revenue and employment data were withheld to avoid disclosure of specific establishments. (The Census Bureau is bound by law to protect the confidentiality of individual establishments, companies and enterprises.)
Nationally, the utilities sector reported revenues of $412 billion, employing nearly 703,000 workers at more than 15,000 locations. Texas, with revenues of $74 billion, and California, with revenues of $27 billion, led all states. Nationwide, the electric power industry generated $269 billion in revenues, while the natural gas industry accounted for $137 billion.
While the Economic Census can provide significant statistical detail on the utility sector in Indiana, it cannot provide us (for aforementioned legal reasons) with the names of those utility companies. But we can look to other resources, such as directories and other public information, to discern specific companies that provide us with, for example, the electricity that is essential to us for life and work. Indiana has three types of electric utilities: investor-owned utilities, municipally owned electric utilities and rural electric cooperatives.
Investor-owned utilities operate both generation and distribution facilities and own the biggest share of generating capacity in the state (approximately 77%). They include: American Electric Power (AEP); Indianapolis Power and Light (IPALCO); Northern Indiana Public Service Company (NIPSCO); PSI Energy; and Southern Indiana Gas & Electric Company (SIGECO) and Indiana Gas Company, Inc., both part of the Vectren Corporation.
Municipally owned electric utilities account for about 14% of Indiana's generating facilities. Municipalities with such facilities include Bluffton, Crawfordsville, Fort Wayne, Jasper, Logansport, Peru, Rensselaer and Richmond. Rural electric cooperatives account for about 7% of the state's generating capacity and include Hoosier Energy and the Wabash Valley Electric Cooperative.
*NAICS Note: The 1997 Economic Census marks the first published joining of NAICS, the North American Industry Classification System, with industry data. NAICS is the new business classification system that replaces the Standard Industrial Classification system begun 60 years ago. See "IN the Details" for more details about the Economic Census
Energy Use in Indiana
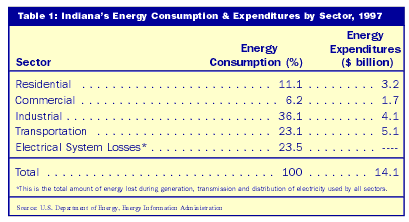
Consumers in Indiana spend more than $14 billion per year on energy, with purchases of electricity and petroleum accounting for most of the total. Energy consumption is a gauge of economic activity and quality-of-life standards. Its use affects all Hoosiers. Table 1 gives estimates of the percentage of energy consumption and expenditures by sector in 1997, the most recent year for which data are available. The percent of net energy use by fuel type for each sector is displayed in Table 2.
Click on table below to see larger version.

Coal, natural gas and petroleum provide 49%, 19% and 30%, respectively, of the total primary energy sources to the state. Other fuels, which make up less than 2%, include hydro, biomass and alternative fuels. There are no nuclear plants located in the state (see Figure 1).
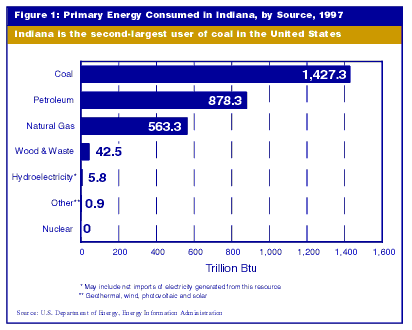
Approximately 40% of the total primary energy consumed in Indiana is used by power plants for the generation of electricity. In 1998, the electric generation was 117,521,000 megawatt-hours of electricity, which ranked 10th in the country. Coal-fired power plants accounted for 98% of the utility electric power generation in the state, consuming 55 million tons of coal. About 10% to 15% of the electricity sales are exported to other states.
On average, less than one-third of the energy used by conventional power plants reaches the consumer due to energy losses in plant cooling water, heat loss from power plant stacks, pollution-control equipment and resistance in transmission lines. Average retail electricity rates in the state are among the lowest in the country and have been very stable. The overall average price for all classes of consumers is $0.0534 per kilowatt-hour, which ranks 10th lowest in the country. The industrial sector consumes almost 50% of the electricity used within the state.
Indiana produced over 36 million tons of coal in 1998, employing slightly fewer than 3,000 miners in the southwest and west-central portions of the state. Indiana ranks eighth in the United States in coal production, approximately 80% of which goes to electric power plants within the state. With increasing restrictions on coal-fired electricity production, however, coal production in Indiana declined 8% in 1999.
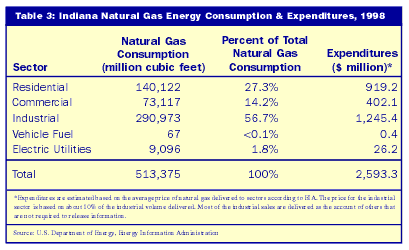
Natural gas within the state is used mainly in boilers, heaters and furnaces for residential, commercial and industrial applications. Other uses include vehicle fuel and chemical feedstock. Table 3 shows the Indiana natural gas energy consumption and expenditures by sector for 1998. On average, expenditures for natural gas may range between 15% and 20% of the total state energy expenditures. Almost 60% of the consumption is used by industry.
Click on table to see larger version.
The transportation sector uses 23% of the state energy consumption and relies almost entirely on petroleum as a source of fuel. Of the total Indiana petroleum energy consumption, about 70% is used in the transportation sector. Annual consumption of motor gasoline, diesel fuel and other petroleum-based transportation fuels totals about 5 billion gallons, of which just under 3 billion is gasoline and 1.25 billion is diesel.
