Regional Employment Snapshot—May 2000
Midwest employment (26 million) represents 20% of total nonfarm employment in the United States, according to the latest federal employment data for May 2000 (see Figure 1). The Midwest is defined as Illinois, Indiana, Iowa, Michigan, Minnesota, Ohio and Wisconsin. The data show U.S. employment at 131 million, 2.3% higher than the same month a year ago. Indiana contributes 3 million jobs, or 2.3% of the U.S. total. Within the Midwest, Indiana represents 11.5% of the region's total employment.
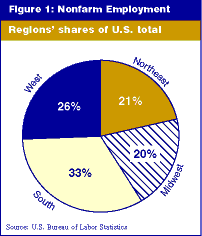
The U.S. Bureau of Labor Statistics provides these data on a monthly basis using the Current Employment Survey (CES). The survey primarily provides nonfarm employment by industry and geographic areas including the United States as a whole, individual states and metropolitan areas. The data are best used to get a year-to-date or month-to-month snapshot of the economy. This month's article discusses regional and state employment. Click here for U.S. regional map.
Regions Led by South and West
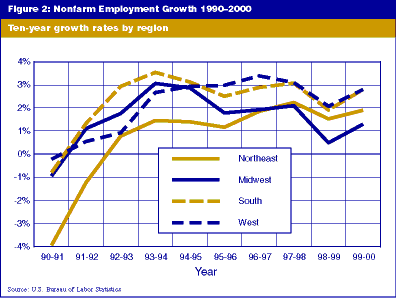
Nonfarm employment in the South and West regions grew faster than the Northeast and the Midwest over the past year. This is a trend that has persisted since 1995, during which period these regions also led in population growth (see Figure 2).
The South constitutes the largest portion—33%—of national employment. The portion of U.S. employment in each region is consistent with the percentage of U.S. population living in each region (see Figure 3).
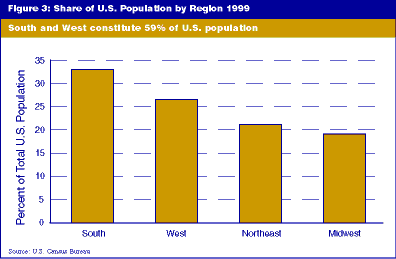
Together the South and West regions have 59% of all U.S. nonfarm jobs and 59% of the U.S. population. These two regions together now equal 0.3% more of the nation's employment than they did a year ago. The Northeast and Midwest regions' share of national employment declined by this same amount over the year. The greatest shift in employment, approximately 0.2%, was from the Midwest to the South.
Manufacturing employment has declined in every U.S. region, with the largest decline occurring in the Northeast (-0.6%). The Midwest and West both declined by 0.5%, while the South is the only region that lost fewer manufacturing jobs than the national average (-0.3% versus -0.4% nationally).
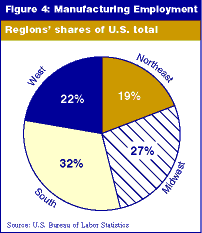
Similarly, the South is the only region with a greater share of national manufacturing employment than a year ago. Thirty-two percent of all manufacturing employment in the United States is located in the South. Meanwhile, the traditional rust belt states of the Midwest constitute only 27% of U.S. manufacturing employment (see Figure 4). However, the Midwest still has the highest percentage of regional nonfarm employment in manufacturing (19.1%). The South follows with 13.4%, the Northeast with 12.6% and the West with 12.2%.
Top 10 States Vary by Perspective
The three states with the highest nonfarm employment growth since May 1998 are Arizona, Florida and Nevada, all growing by approximately 5%. Idaho, Colorado and Georgia followed these states, at approximately 4% (see Table 1).
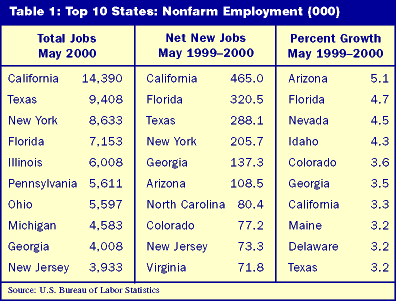
Of these six states, five led U.S. population growth during the same time period. Only Florida's population grew by less than 2%. The age demographics of these six states show no real consistencies that might explain what populations or industries might be driving this job growth. Further research into employment growth by industry might provide some explanation of these trends.
The largest manufacturing state is California, with 1.9 million manufacturing jobs—around 850,000 more than Texas and Ohio (see Table 2). However, in terms of manufacturing jobs per capita, Midwestern states still lead the nation.
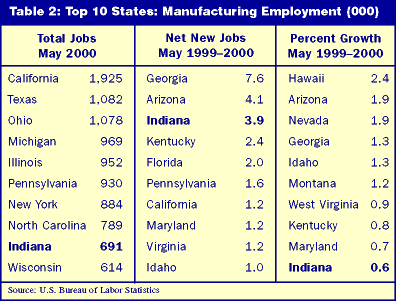
The states with the highest percentage increase in manufacturing jobs over the past year were primarily states with small manufacturing sectors, with the exception of Georgia, which ranks 11th nationally. Logically, however, the larger manufacturing states contributed more net new jobs than the smaller states.
Maryland was the smallest manufacturing state creating the greatest number of net new jobs over the past year. Georgia led the nation, adding 7,600 manufacturing jobs since May 1999, followed by Arizona (4,100) and Indiana (3,900). Of the top 10 largest manufacturing states, only California, Pennsylvania and Indiana added rather than lost manufacturing jobs.
