Income and Population: Indiana's Regions
The Indiana Department of Workforce Development has identified 12 Workforce Investment Planning Regions. These aggregations of counties help us understand labor force issues far better than single-county analyses.
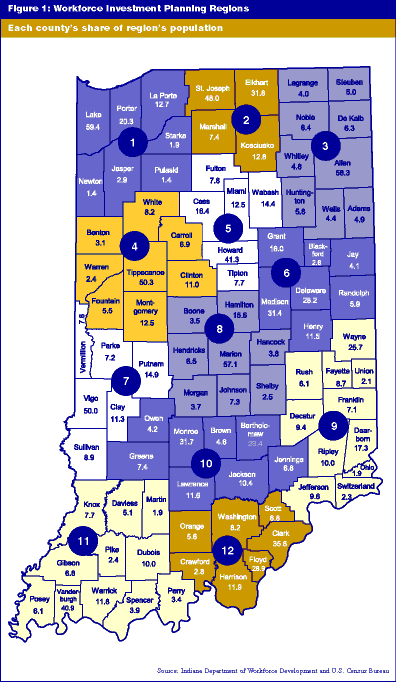
Figure 1 shows these 12 regions and each individual county's share of population within the corresponding region. The regions have considerable variability in certain dimensions. For example, Region 2 (South Bend-Elkhart) has just four counties, while Regions 9 (our eastern border from Richmond south to the Ohio River) and 11 (southwestern counties) each have 11 counties. Region 8 (Indianapolis and suburbs) has 1.4 million people, while Regions 5 (Kokomo) and 7 (Terre Haute) have approximately 225,000 people each.
Click on map to see larger version.

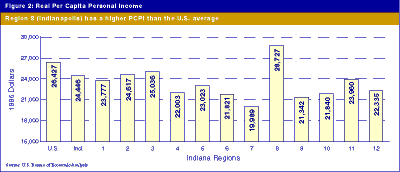
Figure 2 displays the variation in real per capita personal income (PCPI) that exists among Indiana's regions. Region 8 enjoys PCPI at $28,727, which is not only 17.5% higher than the figure for the entire state, but also 8.7% above the national level. Last in PCPI among the regions is Region 7 at $19,989, or 18.2% below the state level. The spread between the highest and lowest regions is 35.7%, the highest differential recorded in the past three decades.
Click on chart to see larger version.

Table 1 indicates that in the most recent year for which regional data are available (1997-98), Region 12 (Clark-Floyd) and Region 8 (Indianapolis) topped both the state and the nation in growth of personal income, population and per capita personal income. Regions 2 (South Bend-Elkhart) and 11 (Evansville) also exceeded the nation's growth rate for personal income and PCPI by realizing slow population growth. Regions 3 (Fort Wayne) and 4 (Lafayette) both had more vigorous population growth combined with lackluster personal income growth and therefore did not match the state or the nation in PCPI growth. By contrast, Region 7 (Terre Haute) managed a somewhat better PCPI growth because it lost population.
Click on table to see larger version.

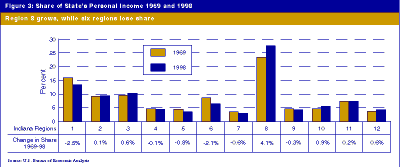
The distribution of personal income across the state has been shifting since 1969. Figure 3 demonstrates that Region 8 (Indianapolis) has grown faster than other regions and thereby has added 4.1 percentage points to its share of the state's personal income. To give abstract percentage points some realism: That is more than $6 billion in 1998 dollars. The largest negative shifts have been in Regions 1 and 6, while small gains have been made by Regions 3, 10 and 12.
Such shifts are part of the continuously changing competitive marketplace, and, if not too rapid, they are economically healthy.

