Per Capita Income: Regions of the Nation
The Bureau of Economic Analysis divides the United States into eight regions. Indiana falls into the Great Lakes region, along with Ohio, Michigan, Illinois and Wisconsin.
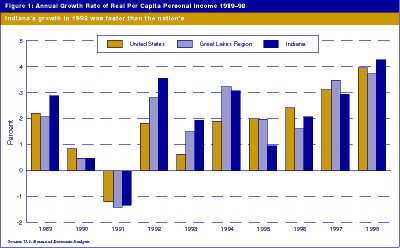
1998, the last year for which detailed data are available, was an outstanding year for the nation. The U.S. growth rate in real per capita personal income (PCPI) was 4.0%, the highest in the past 10 years (see Figure 1). It was also the most successful year in the decade for Indiana and the Great Lakes states, with the Hoosier state ranking second in the region at 4.3%, just behind Wisconsin (4.4%) and ranking 14th among the 50 states.
Click on chart for larger version.

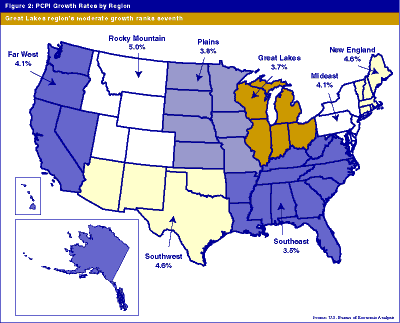
The Great Lakes region, however, ranked seventh among the eight regions in growth of real per capita personal income (3.7%). Only the Southeast advanced at a slower rate (3.5%). The leading region was the Rocky Mountains, which achieved a 5% increase (see Figure 2).
Click on map for larger version.

Personal income is the sum of all earnings (wages, salaries, proprietors' income) plus dividends, interest, rent and transfer payments. After adjustment for price changes, it is labeled real personal income. This amount is divided by population to yield per capita personal income (PCPI).

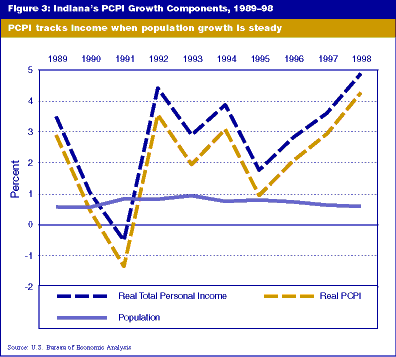
As with any fraction, the growth of the number on the left of the equation depends on the growth of the numerator and the denominator. Basically, the growth rate of PCPI equals approximately the growth rate in personal income minus the growth rate in population. For example, during 1998, Indiana's real personal income grew by 4.9% while the population grew by 0.6%. Therefore, the state's PCPI grew by 4.3%. Figure 3 shows how the growth rate in per capita personal income rises with increases in real total personal income and falls with increases in population. Indiana's population growth has been steady during the last decade, while PCPI has fluctuated with changes in the growth rate for total personal income.

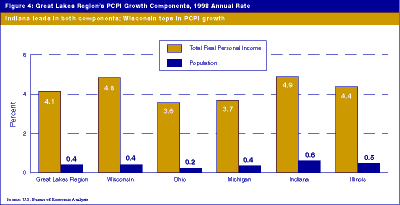
In 1998, Indiana actually led the Great Lakes region in growth rates for both personal income (4.9%) and population (0.6%), as shown in Figure 4. The result, however, was a second-place finish in the PCPI growth to Wisconsin, which had slower growth in both components (4.8% and 0.4%). In the strange race of PCPI growth, being first can sometimes lead to being second.
Click on chart for larger version.

Technical Note: Population Growth and Income Growth... Correlation Far from Perfect
Growth in population and total personal income are positively correlated, particularly over long periods of time. But it is far from a perfect relationship. For the 10 years from 1988 to 1998, the correlation for the 50 states between personal income and population growth rates was +0.89 (where +1.00 is a perfect positive relationship, zero is no relationship and -1.00 is a perfect negative relationship). But for the year 1998, the correlation was just +.62, an unimpressive relationship.
