Indiana college graduates and the question of brain drain

Indiana is third in the nation (behind Pennsylvania and Arizona) in the net in-migration of college freshmen. But we lose nearly 40% of graduates within one year after graduation. Retention is key to Indiana's talent future.
One decade ago, Amia Foston and Tanya Hall wrote in this publication about Indiana graduates and the prevalent concept of “brain drain," where graduates or the most highly trained and/or best educated leave one place for another. With shortages of skilled workers in many industries, Indiana companies have had to compete for talent, making brain drain more relevant than ever.
To update Foston and Hall's work, we looked at two separate but related datasets:
-
Longitudinal Employer-Household Data (LEHD), particularly Postsecondary Employment Outcomes (PSEO) from the Census Bureau
-
State residency tuition data from the National Center for Education Statistics (NCES)
Each of these data sources are used to identify the number of graduates and two key characteristics: where they work after graduation and whether they paid resident tuition. As part of our research, we compared Indiana’s data to a selected group of 11 benchmark states.1
Ten years later, we find that Indiana is still losing college graduates to other states. But it is important to note, and as the data show, Indiana’s large out-of-state student population doesn’t remain in Indiana after graduation.
The Census Bureau currently collaborates with multiple states (including Indiana via the Commission for Higher Education) to integrate university within their national worker dynamics database to determine the migration flows of graduates from Indiana institutions.
From this data, we learned the following:
-
61% of Indiana college grads with a bachelor’s degree were still employed in Indiana one year after graduation.2
-
Retention dropped to 55% after five years.
-
The results did differ, however, when examining the field of study – engineering had a high number of graduates from Indiana colleges, but a very low retention rate – that is, they didn’t stay in Indiana to work.
Engineering was given particular attention due to the high number of graduates produced in Indiana alongside the low retention rate observed in the state. In Indiana, for the 2016-2018 graduation cohort, engineering had the fourth-lowest retention rate for graduates compared to other fields of study, besting only mathematics and statistics (with 37% retention), philosophy and religious studies (26%) and area, ethnic, cultural, gender and group studies (21%). While schools like Purdue and Rose-Hulman produce many qualified graduates every year, the data showed that Indiana retained only 39% of these engineers one year after graduation. Other benchmark states boasted engineering retention rates ranging from 41% in Iowa to 80% in Texas (see Figure 1).
Figure 1: Engineering retention rate for Indiana and benchmark states
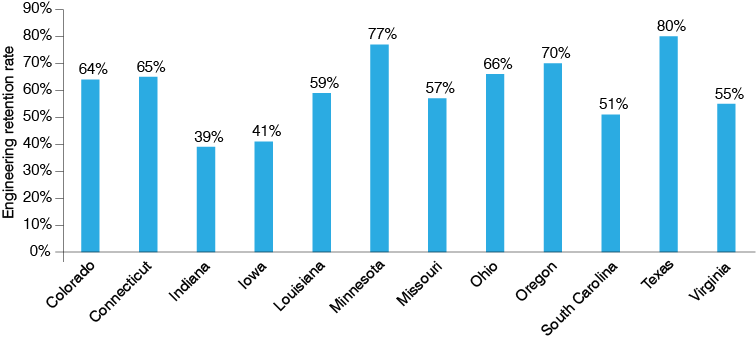
Source: Post-Secondary Employment Outcomes Explorer from the U.S. Census Bureau, 2016-2018 cohort analysis.
The data also confirm what Hoosiers already know: Indiana is a prime educator of engineers nationally. Additionally, Indiana's colleges produce almost half of its in-state demand, unlike most of the other benchmark states. Between 2016 and 2018, Indiana graduated 48% of its statewide engineering demand (when comparing engineering job openings to the number of statewide engineering graduates). Indiana placed second in the field of our 12 benchmark states in meeting in-state engineering demand, trailing only Iowa which met an impressive 71% of its demand (see Figure 2).
Among the benchmark states, Indiana colleges and universities produced the third-most engineers per capita, behind only Iowa and Colorado. Since Indiana punches above its weight in the production of engineering graduates, migration outflow to other states is to be expected as our graduates are pursued by out-of-state employers or those students return to their region of origin.
Figure 2: In-state engineering demand met by graduates produced for Indiana and benchmark states
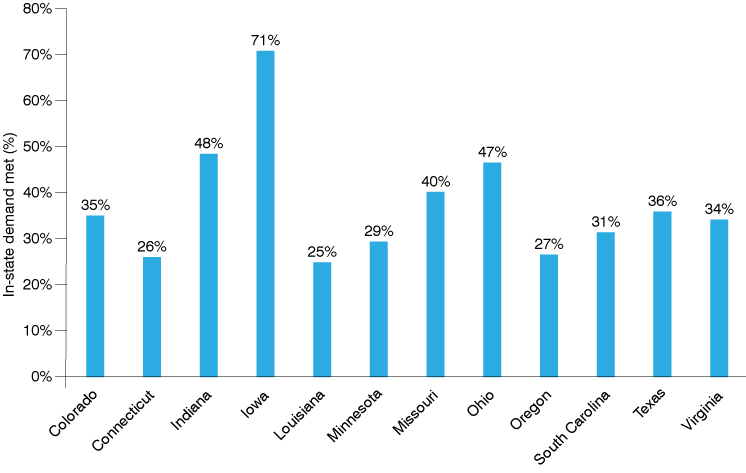
Note: This dataset comprises graduates with a bachelor’s degree in engineering from the 2016-2018 cohort and engineering job openings from 2016 to 2018.
Source: Post-Secondary Employment Outcomes Explorer from the U.S. Census Bureau; Lightcast engineering job openings data
When comparing per capita engineering jobs between states, Indiana falls within 6% of the mean of our benchmark states, suggesting steady employment and growth comparatively. The notion of a weak engineering sector in Indiana is not strongly supported by the per capita job openings for 2016 to 2018 either, as Indiana fell within 5% of our benchmarked mean. Although the median annual earnings for engineers in Indiana were the lowest of the states we compared,3 this was expected due to Indiana’s lower cost of living and higher purchasing power parity.
Low wages are a factor driving the outbound engineer migration mostly to other Midwestern states. However, other outflows show an attraction to Pacific and South Atlantic states, attracting 15% of Indiana’s engineering graduates from the 2016-2018 cohort, where wages have shown to be significantly higher. Other variables that potentially contribute to these outflows (but are not measured here) include cost of living, natural amenities, former residency and quality of life expectations.
As part of our research, we looked at the university with the highest number of engineering graduates per benchmark state (for Indiana, that is Purdue University). In most cases, these benchmark universities produced more than half of each state’s total engineering graduates. Although our benchmark universities from other states boasted far better retention of engineers at the one-year mark, Purdue draws the highest percentage of out-of-state and foreign student populations compared to those universities, according to the National Center for Education Statistics (NCES) College Navigator.4 We believe this contributes significantly to a brain drain, as out-of-state students are generally perceived to leave Indiana for jobs in another state or country that may or may not be their home location.
Since the PSEO data doesn’t include variables on state of origin for the students, we utilized the NCES resident tuition rates from our benchmarked institutions to estimate residency of our total student population.5 With these rates, the results support our hypothesis that Indiana is indeed an education hub for out-of-state students. This is further evidenced by Indiana ranking third among the 50 states in the net in-migration of college freshmen and tenth in the number of total graduate-level engineering students (see the IBRC’s States in Profile).
We believe Indiana’s perceived ”brain drain” in highly skilled occupations, such as engineering, seems overstated. We need to consider the high percentage of out-of-state and foreign student populations. Many engineering students select Indiana for its prestigious educational programs and cost efficiency when compared to other high quality state schools. So, an important question is, how can Indiana compete to retain these graduates with high-demand degrees?
There is a growing need to retain Indiana's domestically educated engineers to work on many of the new (and some quite large) economic development projects. These projects include the multi-billion-dollar White River Project, Amazon's data center project in north central Indiana, the development of the LEAP district in Lebanon, multiple tech commitments from Meta and Google, several foreign computer chip manufacturers and statewide investment in fiber broadband internet and electrical vehicle manufacturers, to name a few. As these capital projects develop, we should expect engineering demand in Indiana to increase accordingly.
Looking at 10-year occupation projections, architecture and engineering occupations are expected to grow 5.2% nationally through the year 2032.6 The average employment change percent for all occupations is only expected to be 2.8% through 2032. It’s worth noting that STEM occupations are projected to increase by 10.8% while non-STEM occupations are only projected to increase by 2.3% by 2032.7 According to data produced by Indiana’s Department of Workforce Development, industrial engineers are the most in-demand engineering occupation in Indiana and those jobs will grow by more than 16% by 2031.8
As demand for engineers grows in Indiana, the state's retention of graduates needs to ramp up to compete for the graduates being produced right here.
Notes
- For our purposes, we compared Indiana data with data for the following states: Colorado, Connecticut, Iowa, Louisiana, Minnesota, Missouri, Ohio, Oregon, South Carolina, Texas and Virginia. For the purposes of this article, we compared all programs of member institutions with undergraduate degree completions from the 2016-2018 cohort.
- Post-Secondary Employment Outcomes Explorer from the U.S. Census Bureau. We used all cohorts for average migration flows data, but used the 2016-2018 cohort for the engineering-specific data. https://lehd.ces.census.gov/applications/pseo/?type=flows&specificity=2&state=18&institution=18°reelevel=05&gradcohort=0000-3&filter=1&destination=geography&display=share&program=00
- Lightcast data.
- Purdue University page on the College Navigator from the National Center for Education Statistics. https://nces.ed.gov/collegenavigator/?q=purdue&s=IN&p=14&l=93&id=243780#enrolmt
- College Navigator from the National Center for Education Statistics. https://nces.ed.gov/collegenavigator/
- Occupational projections, 2022-2032, from the U.S. Bureau of Labor Statistics. https://www.bls.gov/emp/tables/occupational-projections-and-characteristics.htm
- Employment in STEM occupations, 2022-2032, from the U.S. Bureau of Labor Statistics. https://www.bls.gov/emp/tables/stem-employment.htm?src_trk=em663d7d2df1a110.285990601802444130
- Industrial engineers page on INDemand Jobs from the Indiana Department of Workforce Development. https://indemandjobs.dwd.in.gov/Occupation/Soc/17-2112.00/