Immigrants in Indiana: A demographic snapshot of the state's foreign-born population

According to 2022 American Community Survey estimates, Tippecanoe, Bartholomew and Marion counties have a foreign-born population that exceeds 10% of the total population of those counties.
Did you know that nearly half of Indiana’s foreign-born population who entered the U.S. since 2010 has a bachelor’s degree or higher? Or that both student and temporary worker visa admissions in the state are still below pre-pandemic levels?
This article explores the foreign-born population, defined as anyone not a U.S. citizen at birth, using three different data sources: the American Community Survey (ACS) from the U.S. Census Bureau, the Yearbook of Immigration Statistics from the U.S. Department of Homeland Security and unauthorized immigration estimates from the Pew Research Center.
Demographics
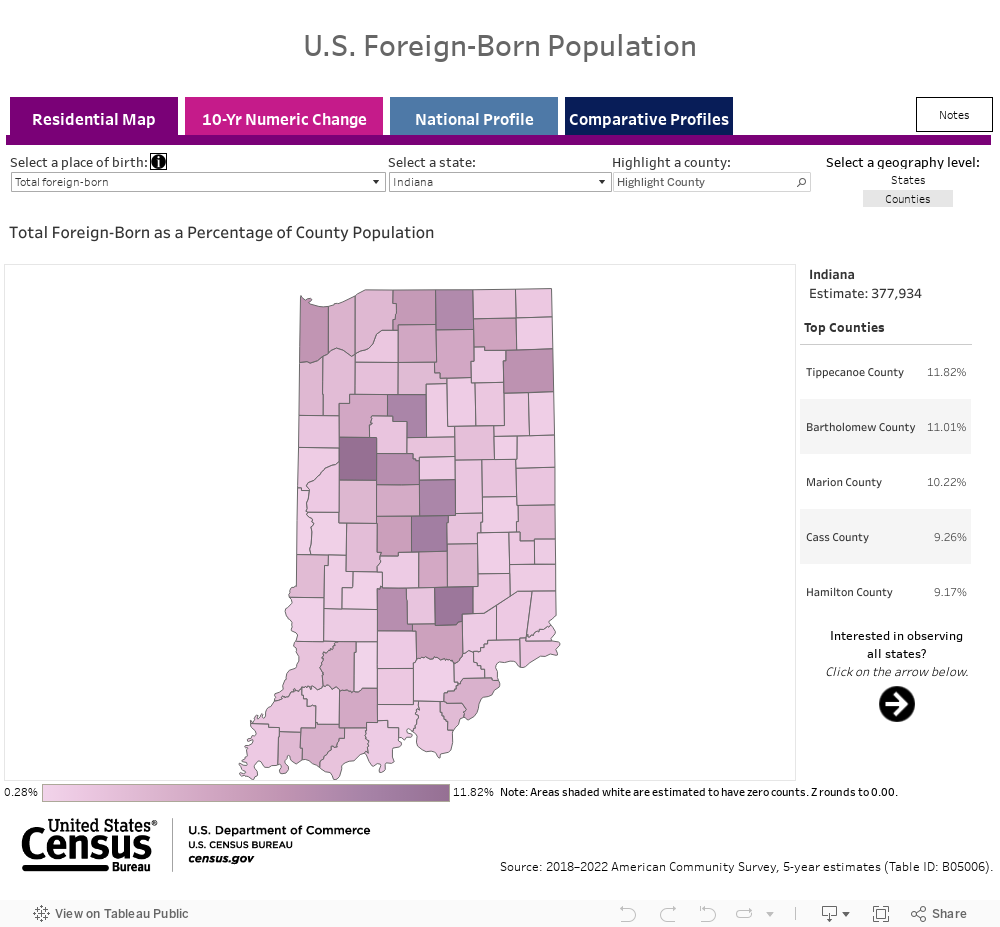
The 2022 ACS five-year estimates indicate that 377,934 people (+/- 5,933) living in Indiana were born in another country. This equates to nearly 6% of the total state population and ranks Indiana 22nd nationwide by numbers and 34th in percentage.
Tippecanoe, Bartholomew and Marion counties have a foreign-born population that exceeds 10% of the total population in those respective counties. At the other end of the spectrum, immigrants comprise less than 1% of the total population in 14 Indiana counties. The proportion of those born in another country ranges from 11.8% in Tippecanoe County to 0.3% in Martin County.
Figure 1 is a visualization created by the U.S. Census Bureau1 showing the total foreign-born data at the national, state and county level. Users can drill down by region and country of birth. However, it is worth mentioning that users should pay special attention to the larger margins of error when looking at the county-level country data.
Interactive Figure 1: U.S. and Indiana foreign-born population
In Indiana, 42% of the foreign-born population were born in Latin America, followed by 35% born in Asia. However, the state has seen the highest percentage of immigrants since 2010 coming from Asia: 43% of these most recent entrants were born in Asia, while 31% were born in Latin America (see Figure 2). In addition, Indiana has seen steady increases in its African-born population, which now surpasses the number of immigrants from Europe (10.5% of the total vs. 10.4%). While this 0.1 percentage point difference does fall within the margin of error, the differential rates of growth suggest that the percentage born in Africa will continue to increase relative to the percentage born in Europe.
Figure 2: Global region of birth for Indiana’s foreign-born population, 2022
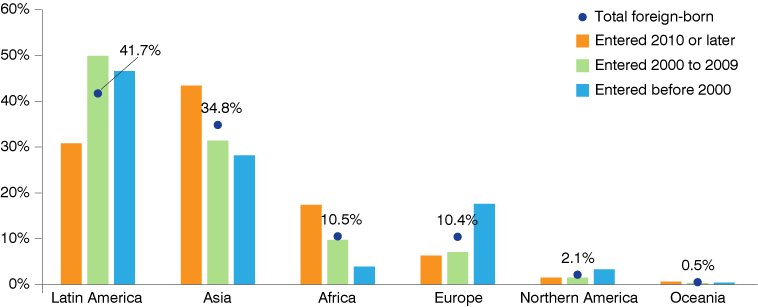
Source: U.S. Census Bureau American Community Survey five-year estimates, Table S0502
In all, 42% of Indiana’s foreign-born population are naturalized citizens, and that rate increases to 68% for those who entered the U.S. before 2000 (see Table 1).
Table 1: Citizenship status of Indiana’s foreign-born population, 2022
| Indicator | Total foreign-born | Entered 2010 or later | Entered 2000 to 2009 | Entered before 2000 |
|---|---|---|---|---|
| Foreign-born population | 377,934 | 140,196 | 108,162 | 129,576 |
| Naturalized citizen | 42.2% | 15.6% | 45.5% | 68.3% |
| Not a citizen | 57.8% | 84.4% | 54.5% | 31.7% |
Source: U.S. Census Bureau American Community Survey five-year estimates, Table S0502
Looking at the population ages 25 and older, we see both higher and lower levels of educational attainment in the immigrant population relative to the U.S.-born population. For example, 9% of the U.S.-born population did not complete high school compared to 26% of the total foreign-born population (or 20% for those who entered in 2010 or later). On the flip side, 10% of the total U.S.-born population in Indiana hold a graduate degree compared to 18% of the total foreign-born population—and this number increases to 22% for the most recent category of immigrants (see Figure 3).
Figure 3: Educational attainment by birth origin in Indiana, 2022
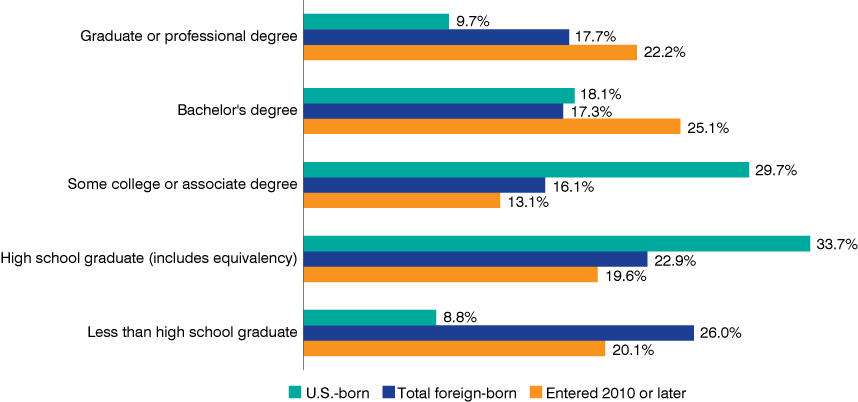
Source: IBRC, using U.S. Census Bureau American Community Survey five-year estimates
It is worth emphasizing that 35% of Indiana’s foreign-born population has a bachelor’s degree or higher compared to 28% for the U.S.-born population. Moreover, 47% of the immigrants living in Indiana who entered the U.S. since 2010 have a bachelor’s degree or higher.
Legal permanent residents
Switching datasets to explore the U.S. Department of Homeland Security data, we see that the number of people obtaining legal permanent residence in Indiana (i.e., “green card” recipients) peaked in fiscal year 2017, but returned to its general pre-pandemic levels in fiscal year 2022 (see Figure 4). The 8,681 recipients in 2022 represent a 2% increase relative to 2019.
Figure 4: Persons obtaining lawful permanent resident status in Indiana
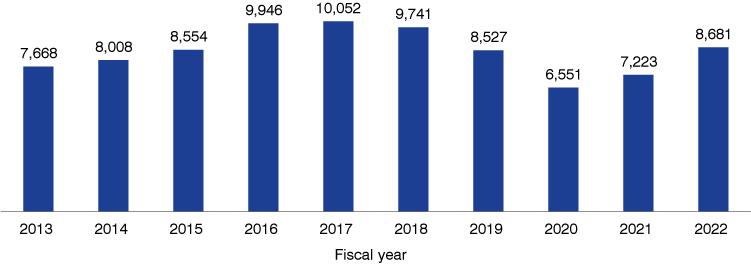
Source: IBRC, using 2022 Yearbook of Immigration Statistics data from the Office of Homeland Security Statistics
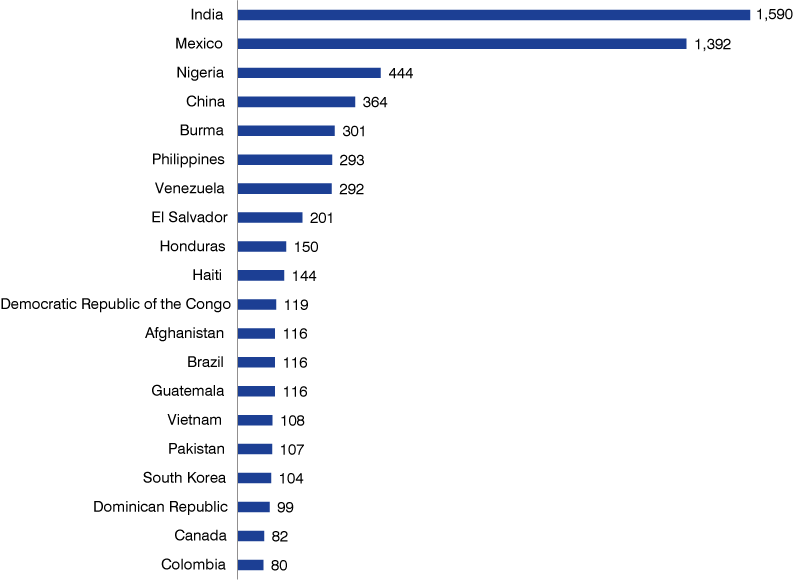
For 2022, 43% of those individuals were born in Asia. Figure 5 shows the leading countries of birth for Indiana’s newest legal permanent residents. India tops the list with 1,590 people, followed by Mexico with 1,392 green card recipients.
Figure 5: Top 20 countries of birth for Indiana's legal permanent resident recipients, fiscal year 2022
Source: IBRC, using 2022 Yearbook of Immigration Statistics data from the Office of Homeland Security Statistics
Nigeria and China come next with 444 and 364 green card recipients, and the relatively small country of Burma (also known as Myanmar) ranks fifth in terms of legal immigrants to Indiana. In fact, Indiana ranks third in the nation for Burmese immigrants in fiscal year 2022, behind only California and New York. Large Burmese refugee communities have existed in Indianapolis and Fort Wayne for over a decade, and for several years beginning in 2009, Burma actually topped this list of countries sending legal permanent residents to Indiana.2
Temporary status for students and workers
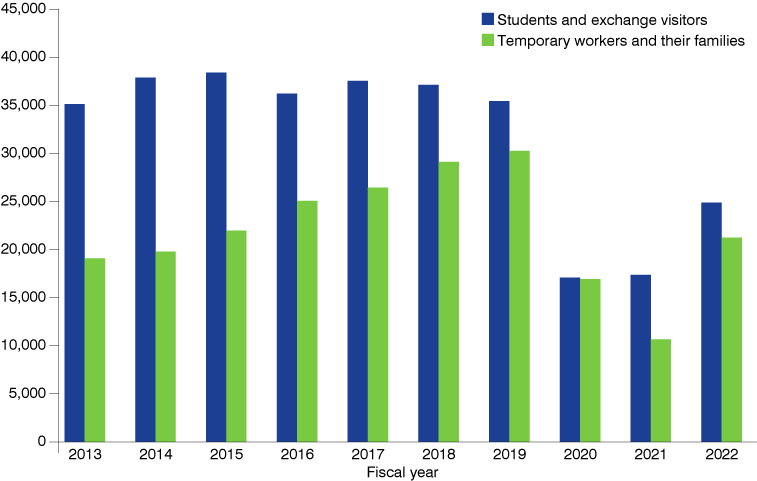
Not all of the foreign-born population plan to stay in the U.S. long term as legal permanent residents. In fiscal year 2022, Indiana’s nonimmigrant admissions for students and exchange visitors totaled 24,888, while temporary workers and families totaled 21,242.
In Indiana, H-1B visas made up the largest category of temporary workers, with 3,482 admissions. The H-1B visa is designed for foreign workers with hard-to-find skills that require theoretical or technical expertise. These visa holders must have a bachelor’s degree or equivalent, and the admittance period is up to three years (this can be extended, but generally cannot go beyond six years total).3
Closely behind, the second largest category of admissions was E-2 visas, with 3,445 Indiana admissions in fiscal year 2022. The E-2 visa is for investors from treaty countries (those with which the U.S. maintains a treaty of commerce or a qualifying international agreement) who invest a substantial amount of capital in a U.S. business, allowing them to enter and work in the U.S. based on their investment. The initial admittance period is a maximum of two years, but an unlimited number of two-year extensions may be granted.4
Table 2: Admissions for temporary workers and families in Indiana — Classifications with more than 1,000 admissions, fiscal year 2022
| Classification | Description | Admissions |
|---|---|---|
| H-1B | Specialty occupations | 3,482 |
| E-2 | Treaty traders and investors: treaty investors | 3,445 |
| TN | NAFTA professional workers | 2,607 |
| L-1 | Intracompany transferees: principals | 2,545 |
| H-2A | Seasonal agricultural workers | 2,163 |
| H-4 | Spouses and children of H-1, H-2 and H-3 workers | 1,677 |
| H-2B | Seasonal nonagricultural workers | 1,623 |
Note: More details about each of these classifications are available from the U.S. Citizenship and Immigration Services website.
Source: IBRC, using 2022 Yearbook of Immigration Statistics data (Nonimmigrant Supplemental Table 3d) from the Office of Homeland Security Statistics
While the number of legal permanent resident recipients has recovered to pre-pandemic levels (as shown back in Figure 4), here we see both student and temporary worker visas lagging behind where they were prior to the pandemic (see Figure 6). In fact, both of these categories are still 30% below their 2019 levels.
Figure 6: Student and temporary worker visas in Indiana
Source: IBRC, using the annual Yearbook of Immigration Statistics data (Table 30) from the Office of Homeland Security Statistics
Unauthorized immigrants
Moving on to our final dataset, the Pew Research Center reports that “as of 2021, the nation’s 10.5 million unauthorized immigrants represented about 3% of the total U.S. population and 22% of the foreign-born population. These shares were among the lowest since the 1990s.”5
According to their estimates, about 110,000 unauthorized immigrants lived in Indiana as of 2021, though the margins of error are high given the difficulty with generating such estimates. Taking the +/-15,000 margin of error into account, that gives us a range of 95,000 to 125,000 unauthorized immigrants in the state.6 Table 3 compares Indiana to its neighboring states.
Table 3: Estimated unauthorized immigrant populations for Indiana and its neighboring states
| Estimates | Margins of error | |||
|---|---|---|---|---|
| State | 2021 | 2017 | 2021 | 2017 |
| U.S. | 10,500,000 | 10,500,000 | 170,000 | 160,000 |
| Illinois | 400,000 | 425,000 | 30,000 | 30,000 |
| Michigan | 120,000 | 110,000 | 20,000 | 20,000 |
| Ohio | 120,000 | 95,000 | 15,000 | 20,000 |
| Indiana | 110,000 | 110,000 | 15,000 | 10,000 |
| Kentucky | 55,000 | 40,000 | 10,000 | 10,000 |
Source: Pew Research Center estimates based on augmented U.S. Census Bureau data
Conclusion
This article has highlighted some facts about Indiana’s immigrant population, but there is much more info to glean about the foreign-born population living in the state. For example, it is quite interesting to use the interactive Figure 1 to look at the county-level data for the top countries for legal permanent resident admissions (mentioned in Figure 5).
One thing we find when doing so is an especially high concentration (as a percentage of the total county population) of those born in India in Bartholomew County. A recent article from their local newspaper, “International migration: H-1B visas for highly skilled workers driving Bartholomew County population growth,” discusses just how critical international migration has been to both the region’s population and economic growth.7
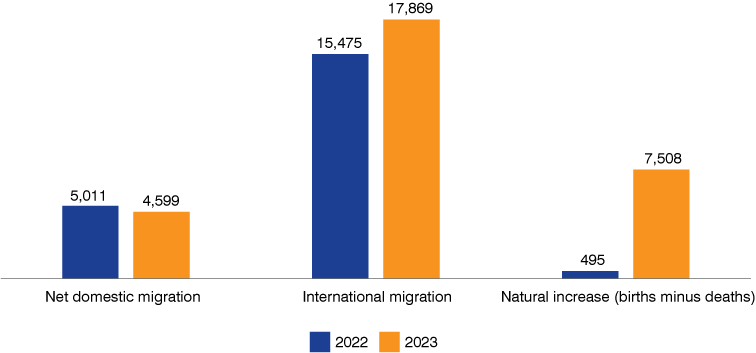
And that is a worthy concept to spotlight: International migration has been the largest driver of population growth in Indiana in the last couple of years (see Figure 7).
Figure 7: Components of Indiana's population change
Source: STATS Indiana, using U.S. Census Bureau population estimates data
To reiterate what my colleague Matt Kinghorn, senior demographic analyst for the IBRC, said in the aforementioned article: “Just looking at the big picture, as the state’s population continues to age, as the Baby Boomer generation continues to age, we’re expecting to see labor force growth slow significantly over the next 10 to 20 years. That’s not great news for our employers. As we move ahead, I think attracting young adults is going to play an increasingly important role for Indiana’s economy. And I think international migration will be a big piece of that puzzle.”8
To continue diving into the topic of immigration, please visit the following resources:
-
Foreign-born population (U.S. Census Bureau)
In particular, you may wish to explore Table S0502 (Selected characteristics of the foreign-born population by period of entry into the United States) in more detail. -
Immigration data (Office of Immigration Statistics, U.S. Department of Homeland Security)
- What we know about unauthorized immigrants living in the U.S. (Pew Research Center)
Notes
- “U.S. foreign-born population,” U.S. Census Bureau, April 9, 2024, https://www.census.gov/library/visualizations/interactive/foreign-born-population-2018-2022.html
- Rachel Strange, “Born abroad: Recent immigrants to Indiana,” InContext, September-October 2013, https://www.incontext.indiana.edu/2013/sept-oct/article3.asp
- “H-1B specialty occupations, DOD Cooperative Research and Development Project workers, and fashion models,” U.S. Citizenship and Immigration Services, last updated 3/25/2024, https://www.uscis.gov/working-in-the-united-states/h-1b-specialty-occupations
- “E-2 treaty investors,” U.S. Citizenship and Immigration Services, last updated 4/5/2024, https://www.uscis.gov/working-in-the-united-states/temporary-workers/e-2-treaty-investors
- Jeffrey S. Passel and Jens Manuel Krogstad, “What we know about unauthorized immigrants living in the U.S.,” Pew Research Center, November 16, 2023, https://www.pewresearch.org/short-reads/2023/11/16/what-we-know-about-unauthorized-immigrants-living-in-the-us/
- The Center for Migration Studies (https://cmsny.org/) also provides state-level estimates of the unauthorized population. The most recent estimate they have derived at the time of this writing is for 2019, in which they estimate Indiana’s undocumented population to be 97,228. See http://data.cmsny.org/ for their data.
- Andy East, “International migration: H-1B visas for highly skilled workers driving Bartholomew County population growth,” The Republic, April 27, 2024, https://www.therepublic.com/2024/04/27/international-migration-h-1b-visas-for-highly-skilled-workers-driving-local-population-growth/
- Ibid.