Retail employment trends

The retail industry will likely continue to experience change, both in employment levels and types of jobs.
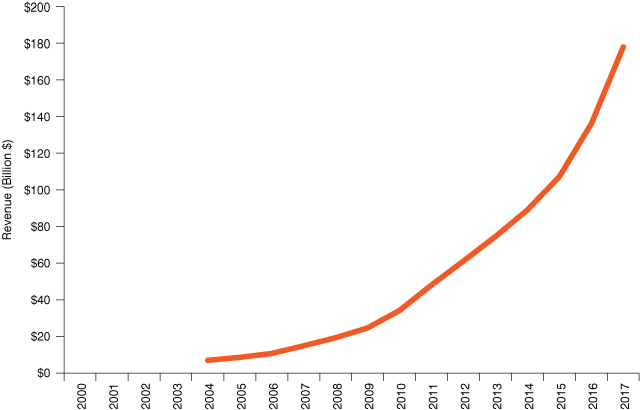
When looking at the explosive sales growth of online retailers like Amazon (see Figure 1), it is natural to wonder about the effects on retail employment. Many over the last few years have prognosticated the future of retail, including the Sage of Omaha, Warren Buffett, who predicts radical changes.1 While change in every economic sector is inevitable, the data currently paint a slightly different picture of retail than some of the more dire predictions.
Figure 1: Amazon sales
Source: Statista
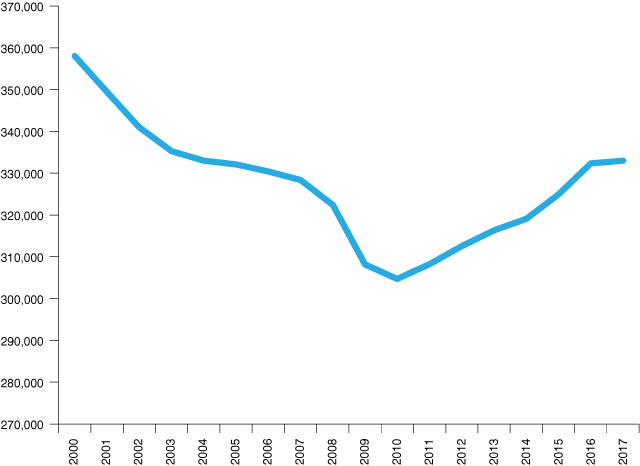
Using the Quarterly Census of Employment and Wages (QCEW) from Hoosiers by the Numbers, Figure 2 shows the state total employment pattern for the retail sector for the same years.
Figure 2: Retail jobs in Indiana
Source: QCEW data from the U.S. Bureau of Labor Statistics
Employment in the retail sector bottomed out in 2010 as a result of the Great Recession. However, it had been shedding jobs the entire decade before during strong economic growth years. In other words, retail employment was falling well before the influence of online sales and retailing.
Online retail sales gained the most traction post 2010. Looking at the employment picture, when online sales growth was accelerating after 2010, the retail sector was adding jobs, not losing them. While retail employment has not returned to the levels of 2000 at the state level, the trends have been positive since 2010.
Online retailing has, thus far, shown little evidence of slowing. It will likely grow and alter the landscape of the retail industry. It will undoubtedly alter the work and types of jobs in the retail sector. However, it might be a little early to make predictions about its impact on retail employment numbers.
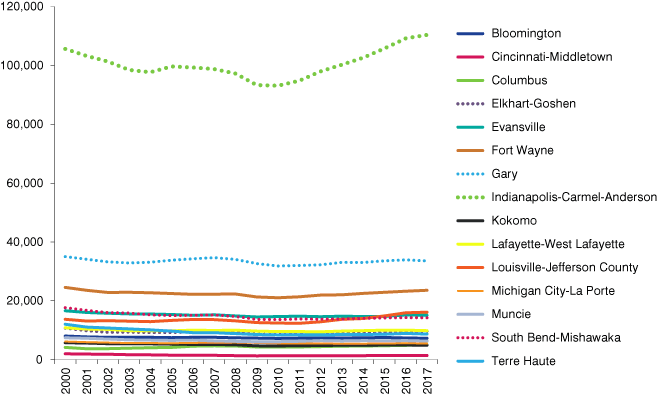
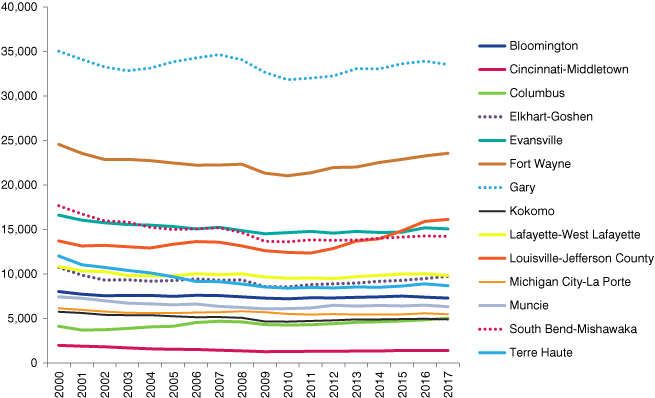
Are the effects of online retailing being felt regionally? Figure 3 shows retail employment for all the metros in the state. As the largest metro is Indianapolis, it was taken out of Figure 4 to better show the other metros.
Figure 3: Retail jobs in Indiana metros
Note: Only the Indiana portions of the metros are included in these data.
Source: QCEW data from the U.S. Bureau of Labor Statistics
Figure 4: Retail jobs in Indiana metros (excluding Indianapolis)
Note: Only the Indiana portions of the metros are included in these data.
Source: QCEW data from the U.S. Bureau of Labor Statistics
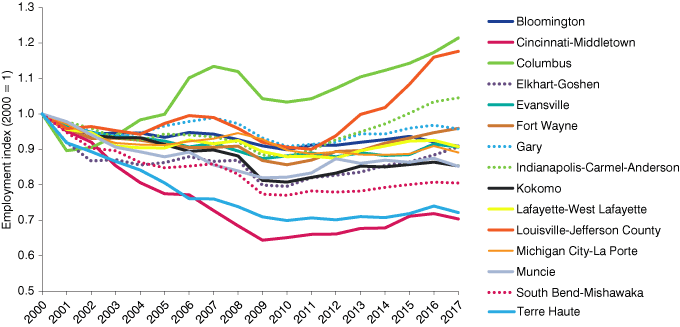
To put all the metros on a common scale, employment in the retail sector was indexed to 2000 levels in Figure 5. By and large, one sees the statewide trends playing out at the metro level as well. Retail employment was declining long before the Great Recession, plunged between 2008 and 2010, and has been recovering since. Three metros—Columbus, the Indiana portion of the Louisville metro and Indianapolis—have actually surpassed their 2000 employment levels. At the other end of the spectrum, the Indiana portion of the Cincinnati metro and Terre Haute remain drastically lower than their 2000 retail employment levels.
Figure 5: Retail employment index for Indiana metros
Note: Only the Indiana portions of the metros are included in these data.
Source: QCEW data from the U.S. Bureau of Labor Statistics
Table 1 takes a closer look at changes since the Great Recession. After 2010—a time when online retailing experienced rapid growth—retail employment was experiencing growth across the board (with the exception of Michigan City–La Porte).
Table 1: Change in retail employment since 2010
| Metro area | 2010 | 2017 | Change | Percent Change |
|---|---|---|---|---|
| Louisville-Jefferson County | 12,434 | 16,138 | 3,704 | 29.8% |
| Indianapolis-Carmel-Anderson | 93,117 | 110,388 | 17,271 | 18.5% |
| Columbus | 4,274 | 5,022 | 748 | 17.5% |
| Elkhart-Goshen | 8,553 | 9,747 | 1,194 | 14.0% |
| Fort Wayne | 21,038 | 23,560 | 2,522 | 12.0% |
| Cincinnati-Middletown | 1,294 | 1,399 | 105 | 8.1% |
| Kokomo | 4,650 | 4,912 | 262 | 5.6% |
| Gary | 31,830 | 33,546 | 1,716 | 5.4% |
| South Bend-Mishawaka | 13,620 | 14,231 | 611 | 4.5% |
| Muncie | 6,110 | 6,335 | 225 | 3.7% |
| Lafayette-West Lafayette | 9,528 | 9,833 | 305 | 3.2% |
| Terre Haute | 8,412 | 8,680 | 268 | 3.2% |
| Evansville | 14,644 | 15,064 | 420 | 2.9% |
| Bloomington | 7,215 | 7,298 | 83 | 1.2% |
| Michigan City-La Porte | 5,523 | 5,482 | -41 | -0.7% |
Note: Only the Indiana portions of the metros are included in these data.
Source: QCEW data from the U.S. Bureau of Labor Statistics
The retail industry will likely continue to experience change, both in the levels of employment and types of jobs. Online retailing will influence these changes. However, the data also suggest that other factors play a large role in these changes as well.
Notes
- Hayley Peterson, “Warren Buffett Just Confirmed the Death of Retail as We Know It,” Business Insider, May 8, 2017, www.businessinsider.com/warren-buffett-just-confirmed-the-death-of-retail-as-we-know-it-2017-5.
