Internet use in Indiana

Over 1 million Hoosiers reported searching for a job online, and nearly 710,400 reported working remotely via the internet.
Internet connectivity has been cited as “a driver of innovation, helping entrepreneurs and businesses remain relevant and competitive in the information age.”1 This article takes a brief look at some internet usage statistics from the National Telecommunications and Information Administration (NTIA) Digital Nation reports to explore how Indiana fares on a handful of measures that are relevant to the workplace.
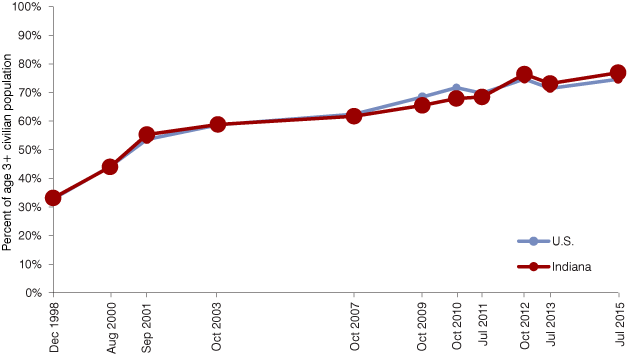
Nearly 77 percent of Hoosiers age 3 and older (over 4.8 million people) are estimated to have access to the internet, according to NTIA’s July 2015 survey—up from 68 percent in July 2011. Going back to 1998, Indiana’s change over time tracks almost identically to the U.S. overall (see Figure 1).
Figure 1: Internet use from any location

Source: National Telecommunications and Information Administration
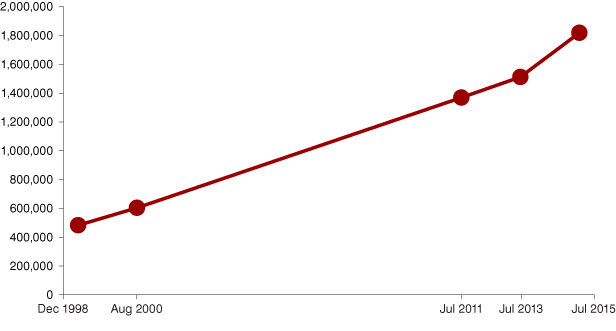
Focusing on internet use at work, Indiana’s numbers grew from 1.4 million people using the internet at work in 2011 to 1.8 million in 2015 (see Figure 2).2
Figure 2: Hoosiers who use the internet at work

Source: National Telecommunications and Information Administration
More than 3.6 million Hoosiers age 15 and older reported email usage in 2015. This is nearly 88 percent of the population age 15 and older who use the internet. This is slightly lower than the nation’s 91 percent, though it is just outside the margin of error.
Meanwhile, 1.2 million Hoosiers reported participating in online video calls, voice calls or conferences in 2015. Over 1 million reported searching for a job online, and nearly 710,400 Hoosiers reported working remotely via the internet.
Table 1 shows how these online activities have become more common in the past couple of years.Table 1: Online activities
| Activity | Share of Indiana population age 15+ who use the internet | |
|---|---|---|
| July 2013 | July 2015 | |
| Using email | 77.5% (+/- 3.9%) |
87.5% (+/- 2.8%) |
| Participating in online video or voice calls or conferences | n/a | 29.7% (+/-4.6%) |
| Searching for a job online | 16.0% (+/- 3.9%) |
24.9% (+/- 4.3%) |
| Working remotely via the internet | 14.6% (+/- 3.7%) |
17.0% (+/- 3.2%) |
| Taking classes or participating in job training online | n/a | 17.0% (+/- 3.1%) |
Source: National Telecommunications and Information Administration
Learn more
To view more of Indiana’s data and state-level maps for all of the metrics, visit the NTIA Data Explorer at https://ntia.doc.gov/data/digital-nation-data-explorer.
Notes
- Indiana Business Research Center, “Driving Regional Innovation: The Innovation Index 2.0,” August 2016, https://www.statsamerica.org/ii2/reports/Driving-Regional-Innovation.pdf, 32.
- This is equivalent to 29 percent in 2015, up from 22 percent in 2011—not statistically different from the U.S. values of 28 percent and 24 percent, respectively. However, since the NTIA used the universe of age 3 and older for this measure, these proportions can be somewhat misleading.
