The Saga of Small Towns
Location, location, location. This phrase, often used in connection with real estate, can also apply to Indiana’s small towns. Since 1990, most of Indiana’s small towns with significant population increases have been located near a major metro.
In fact, small towns located within a metropolitan statistical area (MSA) grew a combined 60 percent between 1990 and 2014. Small towns outside of MSA boundaries only grew 6 percent as a whole.
We explored recent small town population change (from 2010 to 2014) in a previous article.1 We noted that increasing suburbanization seemed to be driving the growth in cities and towns with less than 10,000 people (which we refer to as “small towns” for convenience). Here, we take a longer term look and explore how population has changed in Indiana’s small towns since 1990, with a special focus on differences based on MSA status.
The Backstory
In 1990, Indiana had 504 cities and towns with less than 10,000 residents. By 2014, 490 incorporated areas met that threshold, and 12 percent of the Indiana population lived in a small town.
Small Towns that No Longer Exist
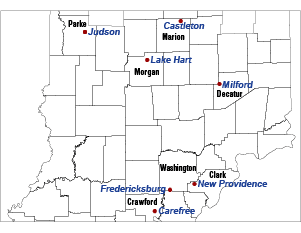
Since 1990, seven small towns have dissolved and no longer exist (see Table 1).
Table 1: Population History of the Small Towns Dissolving between 1990 and 2014
| Town | 1970 | 1980 | 1990 | 2000 | 2010 |
|---|---|---|---|---|---|
| Carefree | - | 41 | 26 | - | - |
| Castleton | 183 | 80 | 37 | - | - |
| Judson | 63 | 80 | 61 | - | - |
| Lake Hart | - | 231 | 213 | - | - |
| Milford | 187 | 177 | 126 | 121 | - |
| New Providence | 337 | 384 | 270 | - | - |
| Fredericksburg | 207 | 233 | 155 | 92 | 85 |

Note: Fredericksburg dissolved in 2012.
Source: IBRC, using U.S. Census Bureau data
Small Towns that Got Bigger
Meanwhile, 13 towns that had less than 10,000 people in 1990 have surpassed that threshold (see Table 2). Back in 1990, Fishers—now the sixth-largest incorporated area in the state—qualified as a small town.
Table 2: Small Towns Surpassing 10,000 Residents Threshold between 1990 and 2014
| Place | 1990 | 2000 | 2010 | 2014 | Change, 1990-2014 | Percent Change |
|---|---|---|---|---|---|---|
| Fishers | 7,508 | 37,835 | 76,794 | 86,325 | 78,817 | 1,049.8% |
| Westfield | 3,304 | 9,293 | 30,068 | 35,297 | 31,993 | 968.3% |
| Zionsville | 5,281 | 8,775 | 14,160 | 25,734 | 20,453 | 387.3% |
| Brownsburg | 7,628 | 14,520 | 21,285 | 23,322 | 15,694 | 205.7% |
| St. John | 4,921 | 8,382 | 14,850 | 16,117 | 11,196 | 227.5% |
| New Haven | 9,320 | 12,406 | 14,794 | 15,608 | 6,288 | 67.5% |
| Chesterton | 9,124 | 10,488 | 13,068 | 13,403 | 4,279 | 46.9% |
| Auburn | 9,379 | 12,074 | 12,731 | 12,834 | 3,455 | 36.8% |
| Cedar Lake | 8,885 | 9,279 | 11,560 | 11,854 | 2,969 | 33.4% |
| Greensburg | 9,286 | 10,260 | 11,492 | 11,817 | 2,531 | 27.3% |
| Yorktown | 4,106 | 4,785 | 9,405 | 11,220 | 7,114 | 173.3% |
| Greencastle | 8,984 | 9,880 | 10,326 | 10,362 | 1,378 | 15.3% |
| Plymouth | 8,303 | 9,840 | 10,033 | 10,095 | 1,792 | 21.6% |
Note: In several cases, annexation played a role in the growth between 1990 and 2014.
Source: IBRC, using U.S. Census Bureau data
With the exceptions of Greensburg in Decatur County, Plymouth in Marshall County and Auburn in DeKalb County, all of these places are located within a metropolitan area, as shown in Figure 1.
Figure 1: Places with Less than 10,000 Residents in 1990 but More than 10,000 Residents in 2014

Source: IBRC, using U.S. Census Bureau data
A Metro/Non-Metro Comparison
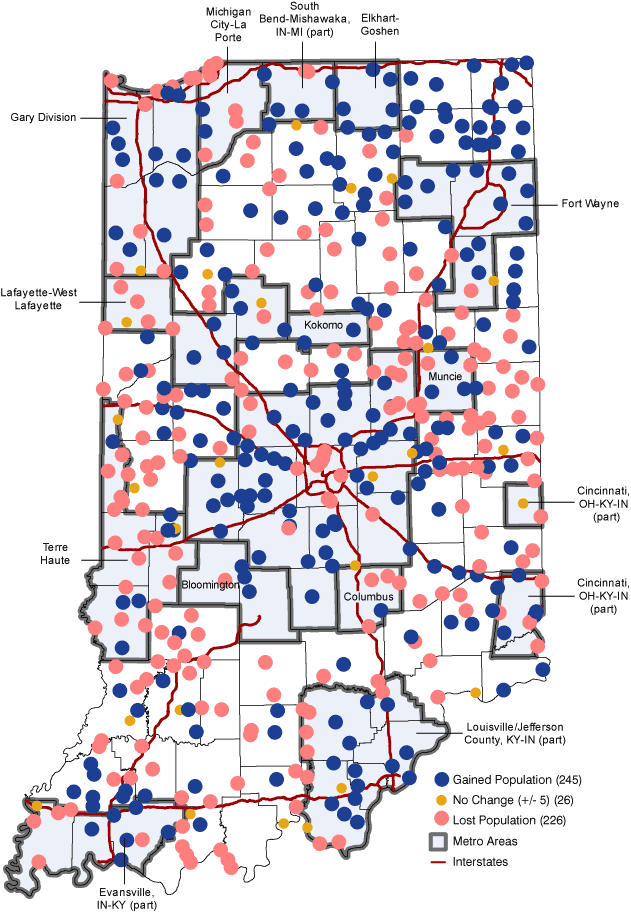
Figure 2 illustrates how small town population change has varied across the state since 1990.
Figure 2: Small Town Population Change, 1990 to 2014

Source: IBRC, using U.S. Census Bureau data
Across Indiana, 236 small towns were located within an MSA. Fifty-five percent of these metros grew between 1990 and 2014.2 Meanwhile, only 44 percent of the 261 small towns in non-metro areas of the state grew.
The median growth for small towns within MSAs was 5 percent, compared to -2 percent for non-metro small towns (see Table 3).
Table 3: Metro/Non-Metro Comparison, 1990 to 2014
| Indicator | Small Towns within an MSA | Small Towns outside of an MSA |
|---|---|---|
| Number of Small Towns* | 236 | 261 |
| Growing | 130 | 115 |
| No Change (+/- 5) | 14 | 12 |
| Declining | 92 | 134 |
| Population Change | 254,098 (60%) | 22,893 (6%) |
| Average Change | 34% | 3% |
| Median Change | 5% | -2% |
*Total number of small towns in 1990, excluding the seven that dissolved during the time frame.
Note: The explosive growth in Fishers pulls the “within MSA” population change figures up slightly. When excluded, the within MSA population change becomes 175,281, and the average falls to 30 percent.
Source: IBRC, using U.S. Census Bureau data
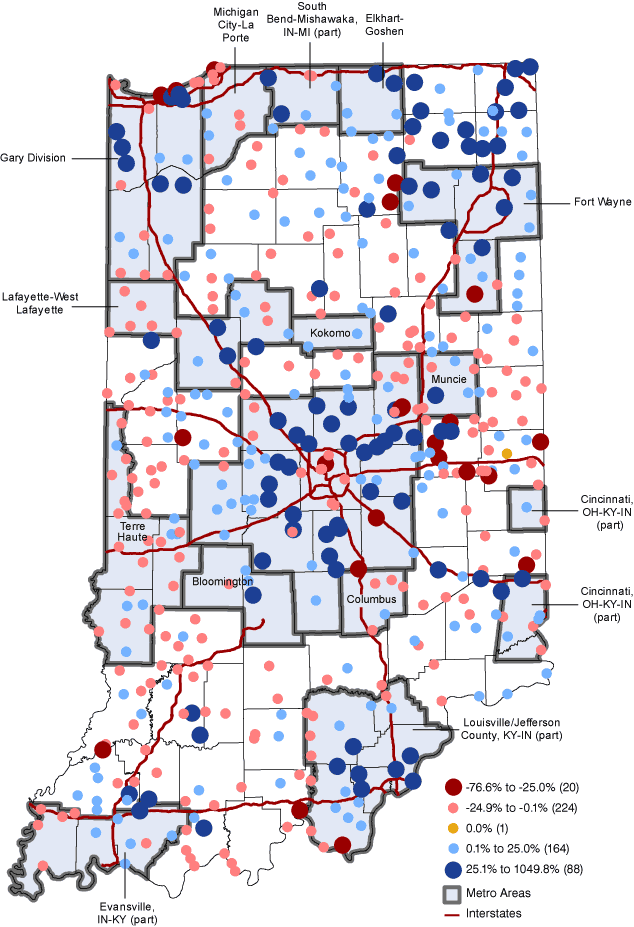
By focusing on the large dots in Figure 3, one can zone in on the places that either gained or lost 25 percent of their population.
Figure 3: Percent Change in Small Town Population, 1990 to 2014
Source: IBRC, using U.S. Census Bureau data
It is obvious that even within the metro/non-metro dichotomy, the experience of small towns has varied. While small towns near Indianapolis have grown 143 percent, those near Evansville, Terre Haute, Columbus and Michigan City have lost population on the whole (see Table 4).
Table 4: How Small Town Growth Varied by Metro Area
| Metro Area | Number of Small Towns in 1990 |
Small Town Population | Change since 1990 | ||
|---|---|---|---|---|---|
| 1990 | 2014 | Numeric Change | Percent Change | ||
| Indianapolis-Carmel-Anderson | 74 | 130,783 | 318,195 | 187,412 | 143% |
| Muncie | 6 | 11,537 | 18,432 | 6,895 | 60% |
| Fort Wayne | 15 | 36,406 | 52,568 | 16,162 | 44% |
| Bloomington | 4 | 6,852 | 9,771 | 2,919 | 43% |
| Gary | 24 | 63,076 | 89,538 | 26,462 | 42% |
| Elkhart-Goshen | 5 | 11,168 | 14,616 | 3,448 | 31% |
| Louisville | 24 | 37,632 | 46,403 | 8,771 | 23% |
| South Bend-Mishawaka | 7 | 8,375 | 10,028 | 1,653 | 20% |
| Kokomo | 2 | 3,160 | 3,485 | 325 | 10% |
| Lafayette-West Lafayette | 15 | 16,564 | 17,629 | 1,065 | 6% |
| Cincinnati | 10 | 19,789 | 20,945 | 1,156 | 6% |
| Evansville | 12 | 25,583 | 25,195 | -388 | -2% |
| Terre Haute | 24 | 34,180 | 33,268 | -912 | -3% |
| Columbus | 5 | 3,586 | 3,473 | -113 | -3% |
| Michigan City-La Porte | 9 | 13,694 | 12,937 | -757 | -6% |
Source: IBRC, using U.S. Census Bureau data
Summary
Overall, Indiana’s total population grew 19 percent between 1990 and 2014. Approximately half of the state’s small towns experienced growth during this time period. In general, small towns located in MSAs grew much faster than those in more rural parts of the state. ![]() Download this small town population change spreadsheet for a closer look at your area.
Download this small town population change spreadsheet for a closer look at your area.
Notes
- Rachel Strange, “Growth and Decline in Indiana’s Small Towns,” InContext, November-December 2015, www.incontext.indiana.edu/2015/nov-dec/article3.asp.
- A change of +/- 5 residents is categorized as no change.
