Labor Shortage. Jobs Deficit. Which Is It?
Economic developers and workforce professionals could look for new targets of job growth as it compares to population gains in order to measure the health of the Hoosier economy.
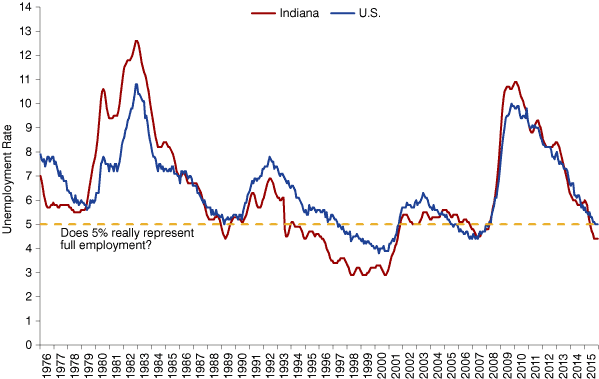
The nation began 2016 in its 78th month of economic expansion, and monthly job growth continues. Across the country, states have hit new peak levels of employment, finally recovering to employment levels seen prior to the Great Recession. Unemployment is also reaching levels historically seen to represent full employment (see Figure 1).
Figure 1: Indiana and U.S. Historical Unemployment Rate Comparison
Source: Indiana Department of Workforce Development and U.S. Bureau of Labor Statistics
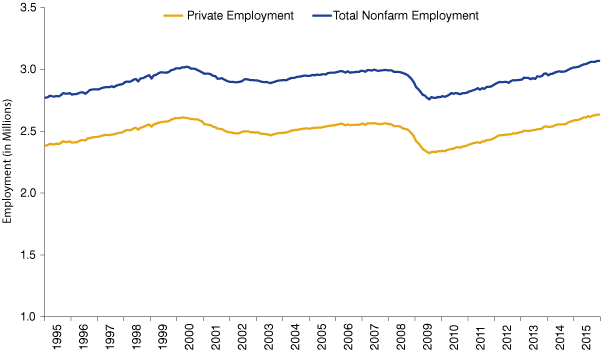
Indiana reached a new peak level of employment in March 2015 when total nonfarm employment rose to 3,022,500. This was the first month employment was above the employment levels seen in March 2000, before the two recessions seen in the 2000s. A second milestone was reached for Indiana when the private sector also hit a new peak in July 2015. Preliminary December estimates for private employment in Indiana are now at a new peak of 2,633,400 jobs, which is 20,800 more jobs than Indiana’s prior peak in March 2000. Total nonfarm employment was at 3,069,200 in December, roughly 47,000 above the levels of early 2000 (see Figure 2).1
Figure 2: Indiana Employment
Source: U.S. Bureau of Labor Statistics
These were important milestones for Indiana and the nation. Nevertheless, debate remains on whether or not the pace of job growth is adequate, and whether the types of newly created jobs are paying high wages in high-growth sectors. The latter question regarding wages won’t be analyzed here; instead, this article will examine the first question as it relates to the potential labor surplus remaining in Indiana.
After six years of recovery, has Indiana gained enough jobs for our economy to be considered strong? Analysis of population trends suggests that despite steady job growth of 4,000 jobs (on average) per month over the last few years, labor surpluses remain and many Hoosiers remain out of work.
Positive economic indicators abound. Indiana ended 2015 with an unemployment rate of 4.4 percent, which is well below the national average unemployment rate of 5 percent. The rate has declined a full percentage point over the last year. This is a particularly strong indicator for Indiana as our labor force continues to grow. Indiana’s labor force participation has risen to 63.9 percent and remains higher than the national average. As of December 2015, Indiana’s labor force is up by 37,762 over the year with gains of 83,844 in employed persons and declines in unemployment levels of 46,082.2
All of these benchmarks indicate a tightening labor market. Yet an examination of Indiana’s population gains over the last 15 years indicates that approximately 160,000 working-age (20-64) people in Indiana are still not in the labor force. This estimate of the working-age labor force participation rate is down by approximately 4 percentage points since 2000, from 74.2 percent to approximately 70 percent at the end of 2015.3
Working-Age Population and Labor Force Participation
The official labor force participation rate is an estimate of how many people are available to work as a percent of the total civilian population. The population is defined as anyone living in the U.S. who is 16 or older and does not include people living in institutions (e.g., prisons, nursing homes and mental hospitals) or those on active duty in the armed forces. As our general population ages, the labor force participation rate naturally shrinks as people age out of the workforce and retire.
Nevertheless, our population gains indicate that the Hoosier working-age population could support 87,000 more private sector jobs to reach a new target private employment level of 2,721,300.
To get a better idea of how we compare to historical levels of working-age labor force participation, we can examine population estimates from census data. The U.S. Census Bureau releases intercensal or postcensal population by age estimates annually.4 According to the 2014 postcensal estimates for Indiana, the prime working-age population (20-64) has grown by 313,000 since 2000. That is growth of over a quarter million working-age Hoosiers in the last 14 to 15 years. This contrasts significantly with labor force gains of only 149,000 over that same time frame. What does that mean for the other 164,000 working-age Hoosiers not working or looking for work?
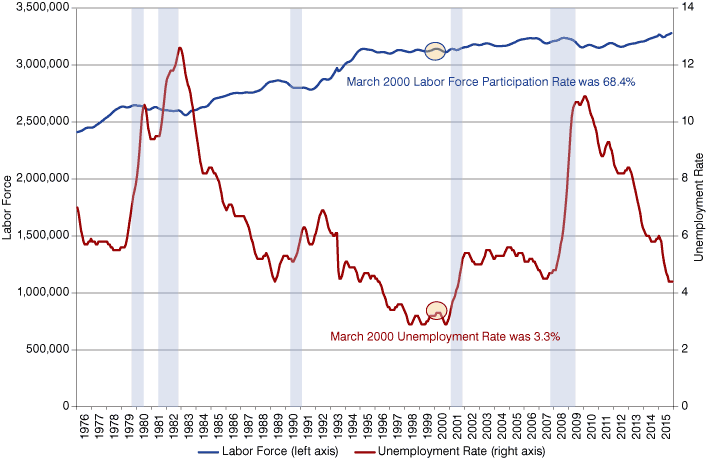
Of these labor force gains, just 47,000 (approximately) are estimated as people employed. This could be interpreted as a potential gap of over 100,000 jobs needed to date just to recoup the level of labor force participation seen historically. Figure 3 illustrates historical unemployment rate trends and labor force participation rates as they compare to the prior “peak” employment era of early 2000.
Figure 3: Indiana Labor Force Levels and the Unemployment Rate
Source: Indiana Department of Workforce Development
Figure 4 illustrates new potential job growth targets for total nonfarm and private sector estimates based on these approximations of population growth.
Figure 4: Potential Private Employment Target
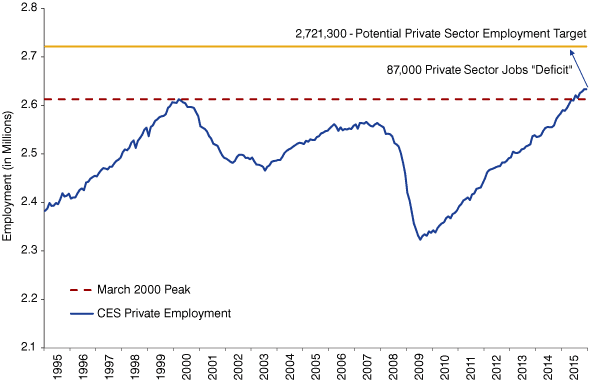
Note: This private sector target is based on a total nonfarm employment target of 3.171 million (i.e., 86 percent of total nonfarm).
Source: Indiana Department of Workforce Development
Changing Industry Mix
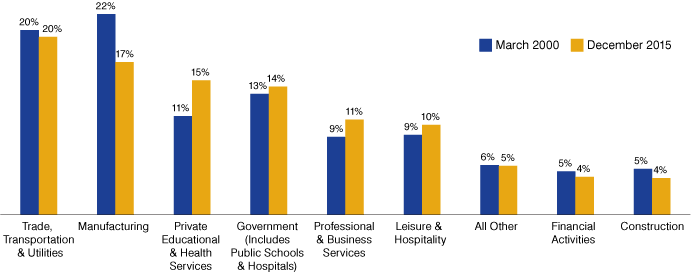
The Hoosier economy has transformed over the last decade. Manufacturing remains one of the top sectors for jobs and wages in Indiana, with approximately 17 percent of all payroll jobs in this sector (based on total nonfarm public and private sector jobs from the Current Employment Estimates). And yet, Indiana's industry composition is changing. Manufacturing, once at 22 percent of jobs, is now second to the trade, transportation and utilities supersector (now at 20 percent of all jobs in the state). Substantial growth since March 2000 has also been concentrated in the education and health industries, both in the private and the public sector. Private education and health has grown from 11 percent of jobs to 15 percent (see Figure 5).
Figure 5: Indiana’s Industry Mix, Prior Private Employment Peak and Today
Source: U.S. Bureau of Labor Statistics (Current Employment Statistics)
Economic developers have historically focused their efforts on job creation in the private sector. Nevertheless, much of the growth during the recovery included jobs in the growing health-care industry in the public sector. These jobs are also often middling- to high-paying STEM jobs, including those in research and development. New job targets could aim for continued industry diversification, encouraging growth in the public and private sectors, including many new jobs in public health and education.
Conclusion
As to the introductory questions of whether Indiana has a labor (skills) shortage or a jobs deficit? The complicated answer may be both.
The estimates in this article were created to serve both the economic development community and educators. Economic developers can show prospective businesses and those wanting to expand business in Indiana that the Hoosier state has the workforce supply to fill new demand. We have a sizeable working-age population not yet engaged with the workforce.
In turn, educators and workforce development professionals can keep an informed eye on the types of jobs those businesses are seeking to bring to the state. A shifting industry mix and other structural changes in the economy necessitate flexible and nuanced alignment in curriculum and training to help job seekers meet employer demand.
Notes
- Source: U.S. Bureau of Labor Statistics, Current Employment Estimates (CES)
- Source: U.S. Bureau of Labor Statistics, Local Area Unemployment Estimates (LAUS)
- Source: Indiana Department of Workforce Development, based on U.S. Census Bureau data
- Intercensal estimates are produced each decade by adjusting the existing estimates between censuses to smooth the transition from one decennial census count to the next. Meanwhile, the postcensal estimates produced after one census but before the next census incorporate current data on births, deaths and migration to produce each new vintage of estimates and to revise estimates for years back to the last census.
