Millennials Outnumber Boomers
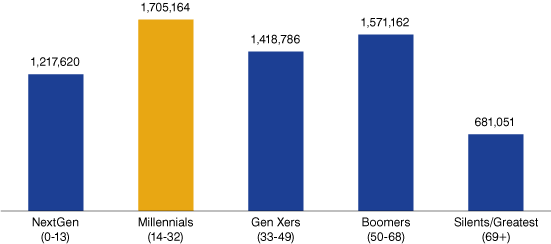
Last year, an unremarked milestone occurred nationally and in Indiana. The iconic baby-boom generation was outnumbered by a new generation, the millennials.
Millennials, those born from 1982 to 2000, make up more than a fourth of Indiana’s total population. The boomers, on the other hand, are now slightly less than one-fourth of the population. At opposite ends of the millennials and the boomers, we have the 13 and younger folks with 18 percent of the population and the 69 and older group at a mere 10 percent.
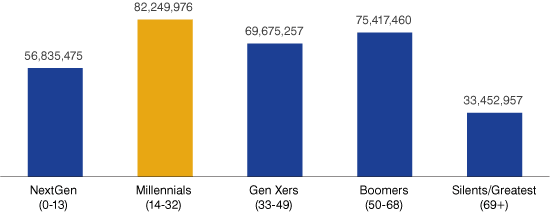
These proportions match the national percentages pretty closely. We provide a comparison of multiple generations in the following graphics that can help us all to be more aware of the shifting sands of time—as seen in the aging of our state.
Figure 1: Indiana Population by Generation, 2014

Source: IBRC, using U.S. Census Bureau data
Figure 2: U.S. Population by Generation, 2014

Source: IBRC, using U.S. Census Bureau data
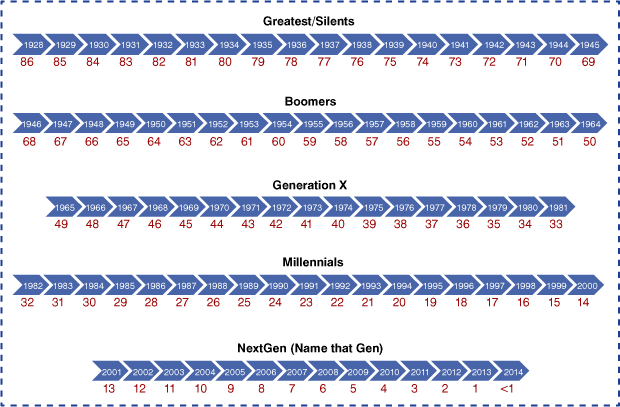
Figure 3: Year of Birth in Each Generation along with Current Age as of 2014

Source: Indiana Business Research Center
In terms of the proportion that each generation represents relative to the total population, the U.S. and Indiana are nearly identical (see Table 1). Indiana has a slightly larger proportion of what we are calling “NextGen” (those 13 years of age and younger).
Table 1: Generations as a Percent of Total Population, 2014
| Age Group | U.S. | Indiana |
|---|---|---|
| NextGen (0-13) | 17.9% | 18.5% |
| Millennials (14-32) | 25.9% | 25.9% |
| Gen Xers (33-49) | 21.9% | 21.5% |
| Boomers (50-68) | 23.7% | 23.8% |
| Silents/Greatest (69+) | 10.5% | 10.3% |
Source: IBRC, using U.S. Census Bureau data
There is no single authority that determines the names of generations nor the span of years that comprise them. Demographers who study the quantitative characteristics of population generally focus on cohorts, often shown in five-year breakouts. Marketers, and more increasingly, human resource professionals, tend to focus on generations in order to hone in on specific defining characteristics that either revolve around consumer habits or workplace issues.
Understanding the general size and proportions of these generational groupings can provide all of us with some critical information about who makes up our labor force. With that information, we can make inferences about the changes in life and work all around us. To that end, this article uses a hybrid of generations from both the Pew Research Center and The Atlantic (which is based itself on a hybrid).
Learn More
Interested in reading more or comparing definitions? Here is a short list of sources used for the curation of this article:
- Pew Research Center, “The Generations Defined,” March 5, 2014,
www.pewsocialtrends.org/2014/03/07/millennials-in-adulthood/sdt-next-america-03-07-2014-0-06/. - The Atlantic, “Here is When Each Generation Begins and Ends, According to Facts,” March 25, 2014,
www.theatlantic.com/national/archive/2014/03/here-is-when-each-generation-begins-and-ends-according-to-facts/359589/. - NOVA (the PBS series), “Be a Demographer,” April 20, 2004,
http://www.pbs.org/wgbh/nova/earth/demographic-data.html.
