Indiana Labor Force Trends: Shrinking Supply May Incentivize Employers and Training Programs to Get Creative and Competitive
Indiana faces a tightening labor market as the state’s unemployment rate continues to decline, now below 5 percent for the last five months. Historically, a 5 percent unemployment rate was considered full employment. This standard has been debated in recent years, as many discouraged workers left the labor force during the Great Recession. Many have questioned the value of the unemployment rate measure given the large number of people leaving the labor force across the nation. But now after years of recovery, the labor force is growing again. In Indiana, that growth rate surpasses the U.S. average. Additionally, estimates of long-term unemployed and discouraged workers are now at levels comparable to the prerecession era of the mid-2000s.1
During the third quarter of 2015, just 23 percent of Indiana’s unemployed were unemployed long-term (over 27 weeks), down from a peak of over 50 percent during the recession (see Figure 1). Total unemployment has also declined by nearly 60 percent, from over 340,000 to under 150,000 in the third quarter of 2015. The long-term unemployed may need more targeted training and recruitment efforts to successfully re-engage in the workforce, yet they are still actively looking for work and in need of employment.
Figure 1: Indiana Long-Term (27+ Weeks) Unemployed as a Percent of Total Unemployment
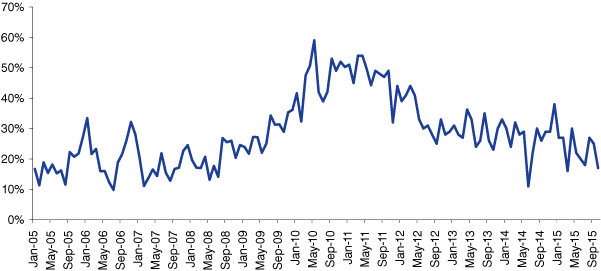
Source: Indiana Department of Workforce Development
Currently, Hoosiers that are out of work experience shorter spells of unemployment on average. These levels mirror trends of the 2006 prerecession era. The average number of weeks a person is unemployed has dropped from a peak of 50 back down to 20 weeks or fewer. These trends lead to a tighter labor market and a shrinking supply of potential employees from the employer’s perspective. True labor shortages and churn among the workforce should eventually lead to wage increases. This may create new pressure among employers for competition and should drive the workforce development system to seek new ways to train and align the workforce to better target employer demand.
This article examines some of the alternative measures of labor underutilization as sources of potential labor supply throughout Indiana (see Table 1).
Table 1: Alternative Measures of Labor Underutilization, 2014 Q4 through 2015 Q3 Averages
| Measure | United States | Indiana |
|---|---|---|
| U-1: Persons unemployed 15 weeks or longer, as a percent of the civilian labor force | 2.4 | 2.0 |
| U-2: Job losers and persons who completed temporary jobs, as a percent of the civilian labor force | 2.7 | 2.5 |
| U-3: Total unemployed, as a percent of the civilian labor force (this is the definition used for the official unemployment rate) | 5.4 | 5.3 |
| U-4: Total unemployed, plus discouraged workers, as a percent of the civilian labor force plus discouraged workers | 5.9 | 5.6 |
| U-5: Total unemployed, plus discouraged workers, plus all other marginally attached workers, as a percent of the civilian labor force plus all marginally attached workers | 6.7 | 6.3 |
| U-6: Total unemployed, plus all marginally attached workers, plus total employed part-time for economic reasons, as a percent of the civilian labor force plus all marginally attached workers | 10.8 | 9.7 |
Source: U.S. Bureau of Labor Statistics
Where Can We Find the Available Workforce Considering the Alternative Measures?
Table 2 shows the breakdown of these alternative measures by Indiana economic growth region (EGR).
Table 2: Alternative Measures of Unemployment by EGR, October 2015 12-Month Average
| Region | Employed | Under-Employed as a Percent of Employed (Part-Time for Economic Reasons) | Percent of State Labor Force | Unemployed | Discouraged Workers | Marginally Attached | Total Potential Surplus (U-6 Proxy Measure) |
|---|---|---|---|---|---|---|---|
| EGR 1 | 376,491 | 3.7% | 12% | 27,694 | 1,242 | 4,619 | 19,767 |
| EGR 2 | 292,100 | 3.6% | 9% | 15,172 | 944 | 3,511 | 15,028 |
| EGR 3 | 355,283 | 3.6% | 11% | 18,314 | 1,148 | 4,269 | 18,271 |
| EGR 4 | 236,199 | 3.6% | 8% | 12,063 | 763 | 2,837 | 12,142 |
| EGR 5 | 930,825 | 3.6% | 30% | 48,492 | 3,008 | 11,192 | 47,895 |
| EGR 6 | 147,818 | 3.7% | 5% | 9,305 | 483 | 1,796 | 7,684 |
| EGR 7 | 93,819 | 3.7% | 3% | 6,540 | 308 | 1,147 | 4,908 |
| EGR 8 | 139,051 | 3.6% | 5% | 8,464 | 453 | 1,686 | 7,214 |
| EGR 9 | 158,339 | 3.6% | 5% | 8,161 | 511 | 1,903 | 8,143 |
| EGR 10 | 139,230 | 3.6% | 5% | 7,279 | 450 | 1,674 | 7,165 |
| EGR 11 | 214,447 | 3.6% | 7% | 10,108 | 690 | 2,566 | 10,982 |
| Statewide | 3,083,602 | 3.6% | 171,593* | 10,000 | 37,200 | 159,200 |
* Approximately 14,000 veterans were unemployed statewide.
Source: Indiana Department of Workforce Development
Figure 2 shows the total potential surplus across the state, which includes those that are discouraged, marginally attached and underemployed.
Figure 2: Total Potential Surplus
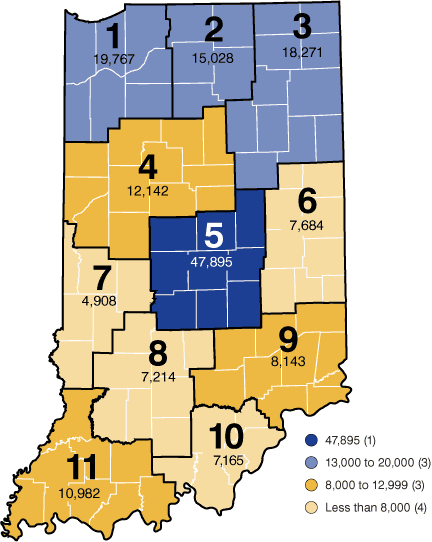
Source: Indiana Department of Workforce Development
Discouraged Workers and Those Marginally Attached
Part of the total potential surplus shown in Figure 2 above are those who have left the official labor force. The CPS measure of discouraged workers are those who have previously “given-up” on finding employment because they believe there are no jobs available or there are none for which they qualify. Discouraged workers now number less than 10,000 per month throughout the state (see Figure 3). This is a decline of over 50 percent from the 2010 average of 21,500 per month. Estimates of where they may be dispersed throughout the state can be seen in Table 2.
Figure 3: Discouraged Workers in Indiana
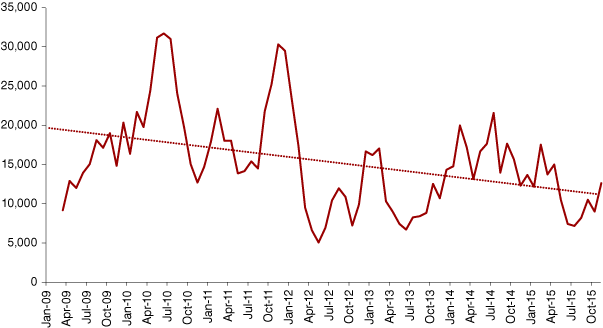
Note: Data are not available for August 2015.
Source: U.S. Census Bureau, Current Population Survey
According to the latest Current Population Survey (CPS) estimates, there are also approximately 35,000 to 40,000 marginally attached workers statewide (i.e., those who want a job and have looked for employment sometime in the prior 12 months but are not currently searching for work). Estimates based on a region’s labor force concentrations are also illustrated back in Table 2. Discouraged workers and marginally attached workers are not considered part of the labor force, so these workers haven’t been factored into the traditional unemployment rate. It may take targeted recruiting, training and continued improvements in the economy to entice them back into the workforce. Yet given the rate at which these estimates have declined recently, there is evidence of continued opportunity to find labor under the right conditions.
Incumbent Workers and Part-Timers
Who among the current workforce can employers entice to fill their labor needs?
In addition to the total unemployed population, which now is estimated at under 150,000 for Indiana, traditional target populations for workforce development and training include the following:
1. Entrant: Students or youth who lack work history
Estimates from the Department of Education indicate that of the approximately 78,000 annual K-12 graduates, 35 percent (27,300) may not go immediately to college and may be seeking full-time employment. An additional student labor force supply source stems from the 26,000 to 27,000 annual higher (public) education graduates that are found employed in Indiana one year after graduation. Figure 4 shows annual estimates based on the latest cohorts of 2013 graduates at the time of this release.
Figure 4: Annual Projected Openings by Educational Level and Student Entrant Supply
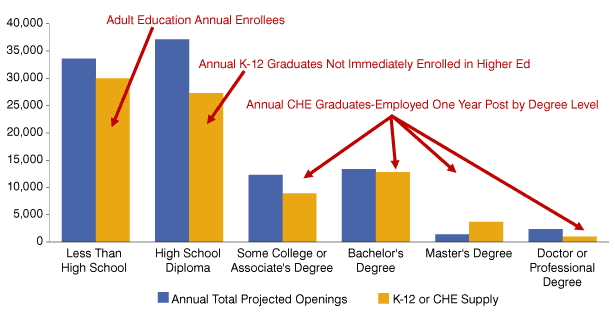
Source: Indiana Department of Workforce Development, Indiana Department of Education and Indiana Commission for Higher Education (CHE)
2. Contingent: Dislocated workers and those in transition (i.e., freelancers, contract workers, etc.)
Estimates of these populations are harder to define throughout the state. Estimates from the U.S. Census Bureau’s Local Employment Dynamics (LED) data indicate that there are an average of 159,000 monthly separations in Indiana and an average of 146,000 new hires. A significant level of churn indicates a strong economy, as employees are able to potentially move up in their careers. Employers can also benefit from a dynamic labor pool.
3. Incumbent: Underemployed workers or those who are pursuing advancement within their careers, including the part-time workforce that seeks full-time employment
Among the 3 million people employed in Indiana, the part-time workforce hovers around 800,000, or 26 percent of the total employed. Those working part-time that were seeking full-time employment has declined significantly over the last few years, yet still remains as high as 110,000 statewide (see Figure 5). Those that are seeking full-time employment and still working part-time are one common proxy measure for “underemployed.”
Figure 5: Part-Time Workers in Indiana
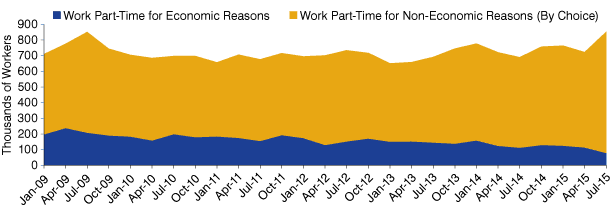
Source: U.S. Census Bureau, Current Population Survey
Changing Population
Additional factors impacting labor force supply involve the changing demographics of Hoosiers. Since 2000, the state’s population has grown by 8 percent (504,000 people). The median age has increased just slightly over two years from 35.3 to 37.5. The near and future pipeline of workers ages 15 to 44 has declined by 2 percent, or roughly 61,000 individuals. The 60-to-64 age group was the fastest growing over this time frame, with gains of 152,000 (see Table 3).2
Table 3: Indiana’s Population by Age
| Age Group | 2000 | 2014 | Change from 2000 | Percent Change from 2000 |
|---|---|---|---|---|
| Total | 6,091,866 | 6,596,855 | 504,989 | 8% |
| Under 5 years | 422,866 | 419,487 | -3,379 | -1% |
| 5 to 9 years | 441,170 | 440,559 | -611 | 0% |
| 10 to 14 years | 445,214 | 450,203 | 4,989 | 1% |
| 15 to 19 years | 455,362 | 455,323 | -39 | 0% |
| 20 to 24 years | 429,055 | 485,738 | 56,683 | 13% |
| 25 to 29 years | 405,966 | 421,760 | 15,794 | 4% |
| 30 to 34 years | 421,950 | 424,167 | 2,217 | 1% |
| 35 to 39 years | 476,361 | 403,725 | -72,636 | -15% |
| 40 to 44 years | 483,617 | 420,956 | -62,661 | -13% |
| 45 to 49 years | 439,773 | 422,569 | -17,204 | -4% |
| 50 to 54 years | 383,665 | 468,543 | 84,878 | 22% |
| 55 to 59 years | 296,197 | 453,137 | 156,940 | 53% |
| 60 to 64 years | 236,858 | 389,244 | 152,386 | 64% |
| 65 to 69 years | 203,269 | 311,219 | 107,950 | 53% |
| 70 to 74 years | 191,514 | 224,892 | 33,378 | 17% |
| 75 to 79 years | 160,182 | 161,530 | 1,348 | 1% |
| 80 to 84 years | 106,803 | 117,380 | 10,577 | 10% |
| 85 years and over | 92,044 | 126,423 | 34,379 | 37% |
| Under 18 years | 1,574,989 | 1,581,927 | 6,938 | 0% |
| 65 years and over | 753,812 | 941,444 | 187,632 | 25% |
| 16 years and over | 4,693,434 | 5,195,715 | 502,281 | 11% |
| 18 years and over | 4,516,877 | 5,014,928 | 498,051 | 11% |
| 15 to 44 years | 2,672,311 | 2,611,669 | -60,642 | -2% |
| Median age (years) | 35.3 | 37.5 | 2.2 | n/a |
Source: U.S. Census Bureau, July intercensal estimates
As the Indiana Department of Workforce Development works to develop a demand-driven workforce development system, understanding the available labor supply will be of vital importance in aligning training and education to future employer demands. Educating and training the pipeline of students will require different approaches than programs targeting the under-employed, incumbent workforce and those that have had long spells of unemployment. Employees and employers alike will need to understand the changing nature of the economy to best compete for an ever-mobile workforce. Several years into this economic recovery, new opportunities abound for Hoosiers to seek training and education and to find employment.