Evolving Industries in Southwest Central Indiana
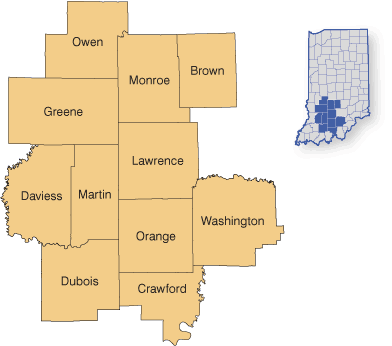
As discussed in a previous issue of InContext,1 an 11-county region in southwest central Indiana (SWCI) is involved in a major strategic planning initiative to chart a course for growth and vitality in the years ahead. Examining the industry makeup and employment dynamics of this region over the last 10 years, we find that some industries and counties fared notably better than others during and after the Great Recession.
Jobs Up and Down, Wages Growing, Fewer Employers
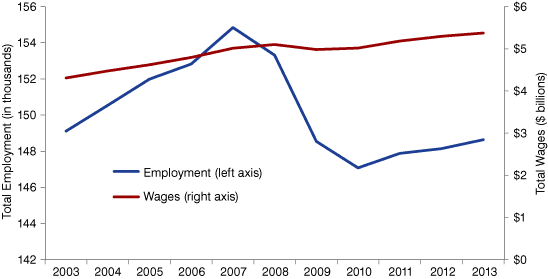
As shown in Figure 1, the SWCI region’s total employment was rising at a healthy rate from 2003 to 2007, adding about 1,500 jobs (1 percent) annually. Then the recession hit, and payrolls shed nearly 8,000 workers over the next three years—a 5 percent drop. After bottoming out in 2010, SWCI employment has resumed growing, but at only one-third the pace of its pre-recession growth. Total employment in 2013 averaged 148,631.
Even though employment had its ups and downs during this turbulent period, total wages experienced only a very slight recession-related decline, growing in all but one year of the decade (see Figure 1). Regional payroll wages in 2013 totaled $5.4 billion, an increase of a billion dollars (25 percent) since 2003. The number of establishments paying those workers, however (not shown), has shrunk since 2007 by 3.4 percent to 8,442 in 2013.
Figure 1: SWCI Region Employment and Wages, 2003 to 2013
Source: IBRC, using annual averages from the Quarterly Census of Employment and Wages (Bureau of Labor Statistics); 2013 data are preliminary.
Not All Jobs Are Created Equal
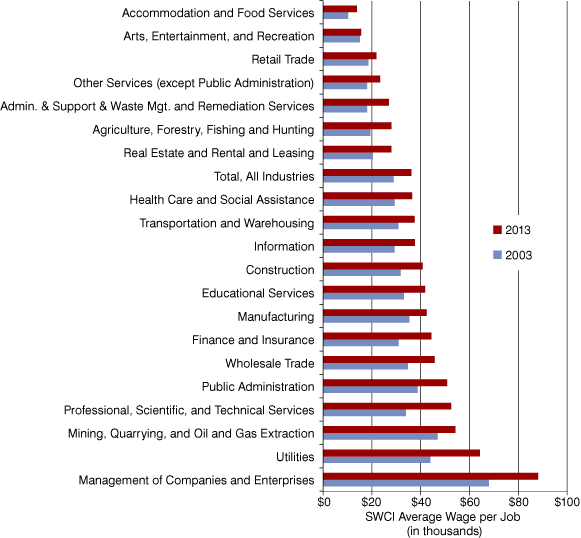
Figure 2 shows the average wage per job in SWCI, broken out by major industry sector, in 2003 and 2013. Quite apparent is the great variation across sectors.
Figure 2: SWCI Region Average Wage by Industry Sector, 2003 and 2013
Source: IBRC, using annual averages from the Quarterly Census of Employment and Wages (Bureau of Labor Statistics); 2013 data are preliminary.
Not surprisingly, management of companies and enterprises led the pack at $88,111 in 2013; this sector accounted for fewer than 1,000 jobs last year, a slight decline over the decade. Though well paid, this small industry accounts for only 1.5 percent of total regional wages, as seen in Figure 3.
Figure 3: Industry Sector Contribution to Total SWCI Wages, 2013
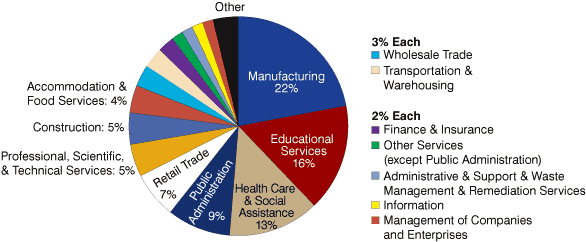
Note: “Other” includes utilities; mining, quarrying, and oil and gas extraction; real estate and rental and leasing; agriculture, forestry, fishing and hunting; and arts, entertainment, and recreation.
Source: IBRC, using annual averages from the Quarterly Census of Employment and Wages (Bureau of Labor Statistics); 2013 data are preliminary.
Other small but highly paid sectors in SWCI include utilities and mining/quarrying/oil/gas extraction, each of which employs fewer than 1,000 workers. At the other end of the spectrum, but comparably small (946 employees), is arts, entertainment and recreation, which has the second-lowest average wage and the smallest contribution of all sectors to total regional wages.
All the industry sectors had average-wage growth between 2003 and 2013 (not adjusted for inflation), but the improvements were quite modest in dollar terms for lower-wage industries, including accommodation/food services, arts/entertainment/recreation, and retail. Percentage growth in average wages was highest (55 percent) for the professional/scientific/technical services sector, which also had the highest percentage growth in employment (40 percent) and total wages (117 percent) over the decade.
Figure 3 reveals that just over half of total 2013 SWCI wages came from manufacturing (22 percent), educational services (16 percent) and health care/social assistance (13 percent). Manufacturing’s total-wages growth over the decade (not shown), however, was under 3 percent. Meanwhile, total wages in educational services grew by 28 percent and in health care/social assistance by 51 percent.
Differences within the Region
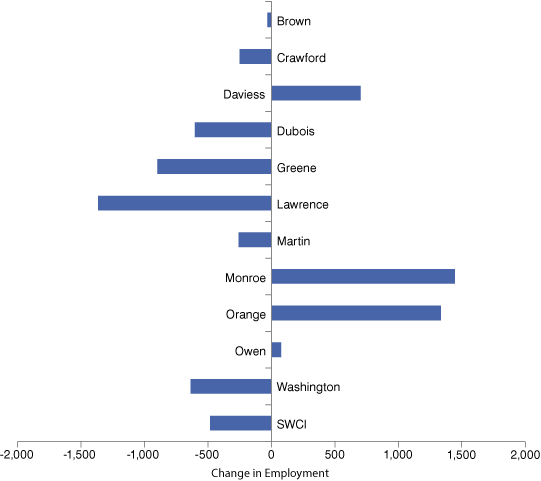
From 2003 to 2013, only three SWCI counties experienced substantial employment growth: Monroe (1,446), Orange (1,336) and Daviess (704), as seen in Figure 4.
Figure 4: SWCI County-Level Change in Employment, 2003 to 2013
Source: IBRC, using annual averages from the Quarterly Census of Employment and Wages (Bureau of Labor Statistics); 2013 data are preliminary.
Seven counties saw declines, four of which were substantial: Lawrence (-1,365), Greene (-899), Washington (-636) and Dubois (-603).
The drivers of employment growth were different in each county:
- Monroe: Health care and social assistance; accommodation and food services
- Orange: Accommodation and food services
- Daviess: Construction; transportation and warehousing; professional/scientific/technical services
Employment shrinkage also varied by county, led by the following:
- Lawrence: Manufacturing (by far the largest); retail; public administration
- Greene: Mining/quarrying/oil and gas extraction; retail; professional/scientific/technical services; construction; public administration
- Washington: Manufacturing
- Dubois: Manufacturing (by far the largest); retail; construction; management of companies and enterprises
Such differences across counties, both positive and negative, accent the diverse nature of the southwest central Indiana region. Those involved in the SWCI strategic planning initiative should seek ways to leverage the region’s strengths in some areas to help offset weaknesses in others.
The SWCI initiative is supported by generous funding from the Lilly Endowment, in collaboration with Energy Systems Network and the Central Indiana Corporate Partnership.
Notes
- Jerry Conover, “Southwest Central Indiana: First Glimpses of an Emerging Region,” InContext, May-June 2014, www.incontext.indiana.edu/2014/may-jun/article2.asp.
