Indiana Grows Increasingly Diverse
The latest U.S. Census Bureau population estimates by race and ethnicity show that Indiana continues to become more diverse, even as the pace of growth in several of the state's large racial and ethnic groups has slowed in recent years. This increasing diversity is most pronounced in Indiana's child population.
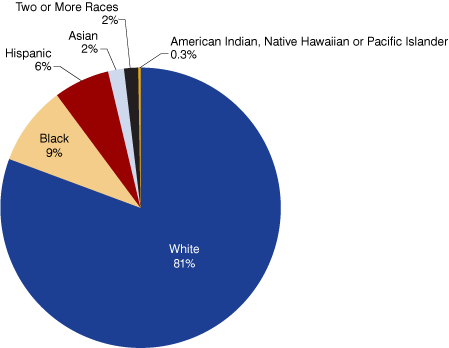
As shown in Figure 1, the majority of Indiana's 6.57 million residents in 2013 are non-Hispanic whites (5.3 million), followed by African-Americans (603,260), Hispanics (422,454) and Asians (121,002). All other non-Hispanic single-race categories (Native American, Hawaiian or Pacific Islander) combined to total 17,051. The number of Hoosiers identifying themselves as multi-race now stands at 106,918.
Figure 1: Indiana’s Population by Race/Ethnicity, 2013

Note: Hispanic is an ethnicity, not a race. Hispanic residents may be of any race. All references to race groups exclude Hispanic residents of that race.
Source: IBRC, using U.S. Census Bureau data
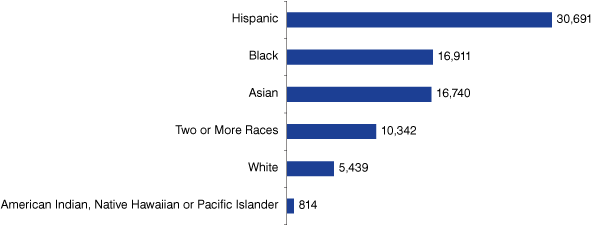
From 2010 to 2013, the Hispanic population showed the largest growth of any race or ethnic group in the state with an average increase of 10,230 new residents per year. By comparison, the state’s black population and Asian population have both grown by an average of roughly 5,600 residents per year over the same period (see Figure 2).
Figure 2: Population Growth by Race/Ethnicity, 2010 to 2013

Note: Hispanic is an ethnicity, not a race. Hispanic residents may be of any race. All references to race groups exclude Hispanic residents of that race.
Source: IBRC, using U.S. Census Bureau data.
The state's non-Hispanic white population has increased by 1,810 residents per year over the past three years. The Hispanic population alone accounted for 38 percent of Indiana's total growth so far in this decade.
With the exception of the Asian population, the growth in each of Indiana’s major race and ethnic groups in recent years has been much lower than their average annual increase from 2000 to 2010. Indiana's Hispanic population grew by an average of 17,510 residents per year in the past decade, while the black population averaged 7,660 new residents per year. Over the same period, the state's non-Hispanic white population grew by an average of 6,430 residents per year, and the Asian population had an annual increase of 4,320.
As a result of these varying growth trends, Indiana has become more diverse. The non-Hispanic white population's share of Indiana's total dropped to 80.7 percent in 2013 from 86 percent in 2000. Over the same period, the state's black population climbed from 8.4 percent of the total to 9.2 percent. Indiana's Hispanic residents now account for 6.4 percent of the state's population, compared to 3.5 percent in 2000.
Looking at the nation as a whole, the non-Hispanic white population accounts for 62.6 percent of the total population. The Hispanic population is the nation’s second-largest race or ethnic group at 17.1 percent of the total, followed by the black population at 12.4 percent.
Greater Diversity in Youth Population
The nature of the growth within the state's child population underscores Indiana's growing racial and ethnic diversity.
From 2010 to 2013, the number of non-Hispanic whites younger than 18 declined by nearly 32,820 residents, while the number of black children in the state fell by 2,560 over the same period.
Meanwhile, the Hispanic population younger than 18 increased by 7,900 residents and the number of Asian children grew by 3,820. In all, the state's total child population dropped by roughly 19,860 residents in the past three years—a 1.2 percent decline.
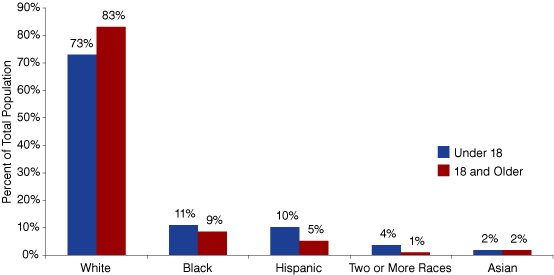
Because of its strong growth in the younger age groups, Hispanic residents now account for 10.3 percent of the total Indiana child population, compared to 5.2 percent of the state's population age 18 or older. By contrast, non-Hispanic white residents make up 73 percent of the state's population younger than 18, compared to 83.1 percent of the adult population. Indiana's black residents account for 11 percent of the child population and 8.6 percent of the adult population (see Figure 3).
Figure 3: Race/Ethnicity by Age Group, 2013

Note: American Indians, Native Hawaiians and Pacific Islanders comprise 0.2 percent of both age groups. Hispanic is an ethnicity, not a race. Hispanic residents may be of any race. All references to race groups exclude Hispanic residents of that race.
Source: IBRC, using U.S. Census Bureau data
Local Population Shifts
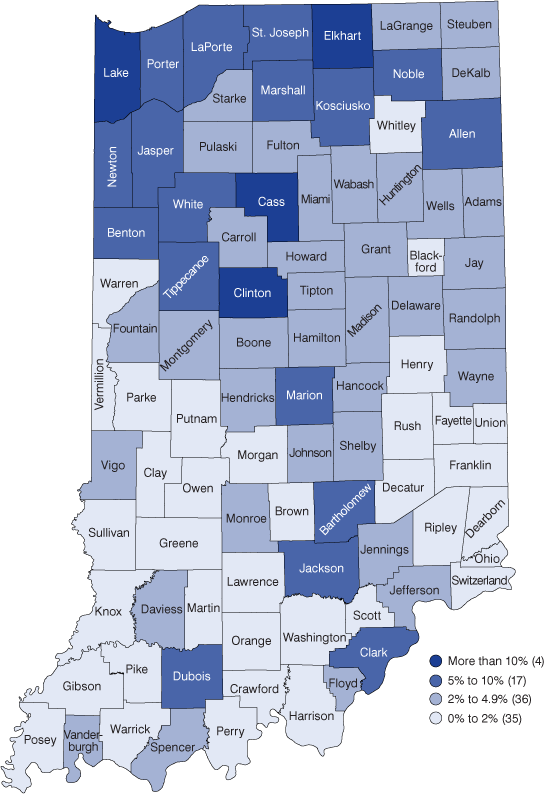
Most of the counties with the greatest concentration of Hispanic residents are found in northern Indiana. In Lake, Elkhart, Clinton and Cass counties, more than 13 percent of the population is Hispanic. These four are followed by Noble (9.9 percent), Marion (9.7 percent), Marshall (9.3 percent) and Porter (9.2 percent) counties (see Figure 4).
Figure 4: Hispanic Residents as a Percent of Total Population, 2013

Note: Hispanic is an ethnicity, not a race. Hispanic residents may be of any race.
Source: IBRC, using U.S. Census Bureau data
Among counties with at least 500 Hispanic residents, Lawrence County had the fastest Hispanic growth rate from 2010 to 2013 (8.6 percent increase per year), followed by Dearborn (6.2 percent), Boone (6 percent), Hendricks (5.8 percent) and Wells (5.3 percent) counties. In each of these counties, however, the Hispanic population still represents a relatively small share of the county total compared to the state average.
Marion County had the state's largest numeric increase in the black population over the past three years, averaging 3,145 new residents per year since 2010, followed by Hamilton (592 per year), Hendricks (531), Allen (454) and Tippecanoe (439) counties. Among counties with at least 500 black residents, Boone County's 17 percent average annual increase in its black population was the state's most rapid growth rate from 2010 to 2013. Johnson County was not far behind with a 13.7 percent annual growth rate over the last three years.
In terms of absolute numbers, Marion County and Lake County combined to account for 61.4 percent of Indiana's total black population in 2013.
Marion County leads the state with an Asian population of 22,114, followed by Hamilton County with 15,923 Asian residents. The university communities of Tippecanoe County (6.7 percent of all residents) and Monroe County (6 percent) had the highest concentrations of Asian residents, followed by Hamilton County (5.4 percent) and Bartholomew County (5 percent).
For more information about these estimates, go to the Population topic page at STATS Indiana.
