Products not Commodities: The Indiana-European Trade Connection
Agriculture is a thriving industry within Indiana, serving as an important contributor to the state’s economy as an employer and exporter of agricultural goods.1 In 2010, Indiana exported $28.7 billion worth of goods to foreign countries, of which 12 percent was devoted to agricultural products.
Eight of Indiana’s top 20 export destinations are European Union (EU) countries, reflecting the strong trading relationship between Indiana and the EU for both agricultural and non-agricultural products. This article defines the EU’s common agricultural policy and euro zone; highlights the trading trends between the United States and the EU; and explores agricultural and non-agricultural trade trends between Indiana and the EU.
The EU and Its Common Agricultural Policy
There are three fundamental functions of Europe that are critical to trade with Indiana (as well as any other place). The first is the union of European countries, the second is related to the first but is arguably the most important and that is the euro as a common currency. The third is the subsidization of farming in Europe. Each is described below:
-
The European Union has grown into an economic community of 27 countries since its informal inception in the 1950s, officially acquiring its moniker in 1993.
-
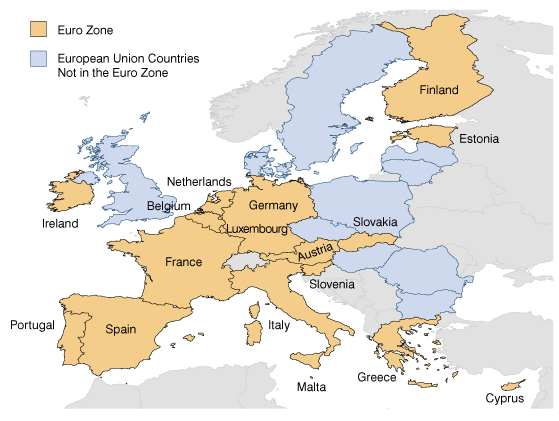
The monetary union (the euro zone) was established in 1999. The euro zone consists of 17 EU member states that have adopted the euro as their common currency (see Figure 1).
-
The common agricultural policy (CAP) was created following a decade of severe food shortages during and after World War II. An important program for EU farmers and rural development officials, CAP is designed to provide farmers with a reasonable standard of living, consumers with quality food at fair prices and to preserve rural heritage. This is done through an integrated system of measures designed to maintain commodity prices within the EU and subsidize production. In 1984, 71 percent of the EU budget was devoted to CAP, whereas today the program comprises 41.3 percent of the EU budget. By 2013, the CAP budget will shrink again to an expected 33 percent of the EU budget.2
Figure 1: Euro Zone Countries, 2011

Source: Indiana Business Research Center
Comparing Agriculture Production in the U.S., Indiana and the EU
Within the United States, 2.2 million farms cover 919.8 million acres, making the U.S. a major producer of agricultural goods.3 In 2007, the U.S. had 335 million acres used for crop production—particularly corn, soybeans and wheat. In 2009, the nation produced $283 billion worth of agricultural goods, of which 38.3 percent was exported. The nation’s top five commodities produced were cattle and calves, corn, soybeans, dairy products and broilers.4
Indiana is one of the top producers of several commodities, with 61,500 farms covering 14.8 million acres. This equates to 2.8 percent of all farms and 1.6 percent of all farmland in the United States. The state was responsible for 3.1 percent of the value of all agricultural commodities produced in 2009, thanks to its top five commodities of corn, soybeans, hogs, dairy products and chicken eggs. The state is also a large exporter of agricultural products (39.1 percent of total production in 2009), ranking eighth among all states with a value of $3.4 billion.5
Turning our attention to Europe, the EU had 7.31 million farms under single management as of 2007, with 76 percent being distributed between Italy (19 percent), Poland (15 percent), Spain (13 percent), Romania (12 percent), Greece (10 percent) and France (7 percent).6 Similar to the U.S., the EU has experienced a subtle decline in the number of farms over time. In 2007, roughly 397,400 acres were being utilized for agricultural purposes—accounting for one-third of EU territory. Slightly more than half (51.2 percent) of the utilized agricultural land area is in France, Spain, Germany and the United Kingdom. The EU’s top agricultural goods include cereals (wheat, barley, corn, rye and rice), sugar beets, fruits and vegetables, and vineyard products. The EU also raises cattle, pigs, goats and sheep, of which most have seen declines in production (except for pigs and recently veal).
Trade between the U.S. and the EU
Within the past decade, the EU has had significant growth in its own agricultural exports to its worldwide trade partners, particularly from 2003 through 2007 due to the exchange rate of the euro against the dollar.7 As of 2009, the EU and U.S. were neck and neck in their shares of agriculture exports.
The U.S. Department of Agriculture’s Foreign Agriculture Service (FAS) reports agricultural trade in five categories — consumer-oriented, intermediate, bulk, forest products and fish products. Consumer-oriented products are relatively ready for immediate consumption and include products such as wine and beer, spices, processed fruits and vegetables and cheese. Intermediate goods tend to be products that would help create final goods, such as vegetable oils, live animals, and sugars, sweeteners and beverage bases. Bulk goods would be considered “raw” agricultural products. The other two categories are self-explanatory.
The European Union is an important trade partner with the United States, importing $244.4 billion worth of products in 2010.8 Collectively, the 27 EU countries ranked as the second largest importer of U.S. goods, though it often alternates with Canada for the top spot. Of the $244.4 billion, agricultural products comprise a relatively small 4 percent of exports. The majority of the exported agricultural products are consumer-oriented (37.7 percent), followed by intermediate foods (22.7 percent), bulk goods (21.5 percent), fish products (9.3 percent) and forest products (8.8 percent).
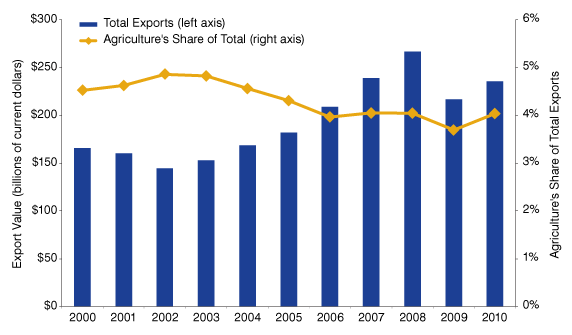
Over time, the percentage of agricultural related exports as a share of all exports to the EU has remained relatively constant, ranging between 4 percent and 5 percent (see Figure 2). The 2010 value of EU-destined agricultural exports was $8.9 billion, making it the fifth largest export destination.9 Despite being the fifth largest market, the EU only accounts for 7.7 percent of all U.S. agricultural exports worldwide. Historically, the EU has always been a top-five export destination of agricultural goods—even serving as the second largest importer from 1989 through 1998.
Figure 2: U.S. Exports to the EU, 2000 to 2010

Source: WISER Trade and USDA
The U.S. also imports agricultural goods from the EU and did so to the tune of $15.5 billion in 2010. As of 2009, the U.S. serves as the largest importer of EU goods, accounting for 16.7 percent of all the goods exported from the EU.10 Of the FAS-defined categories, the bulk of the imported goods from the EU were in the consumer-oriented category (63.1 percent), followed by intermediate goods (28.3 percent), forest products (3.8 percent), seafood (2.8 percent), and bulk products (2.0 percent). The largest share of the imports were devoted to wine and beer (28.8 percent) followed by essential oils (12.7 percent) and other consumer-oriented products (11.0 percent)—this includes carbonated drinks, honey/tea, pet food and other products. Therefore, it is apparent that nearly all of the agricultural goods imported from the EU were either nearly consumption-ready or intermediate products for final goods.
Indiana and EU Trade
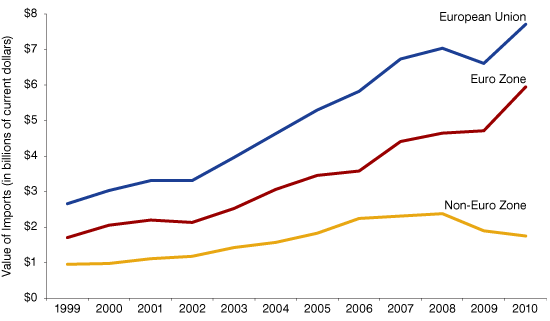
In 2010, EU countries imported more than a quarter of Indiana’s exports (27 percent) for a total of $7.7 billion. The EU’s share of Indiana’s exports has consistently hovered around 20 to 30 percent since 2000, peaking at 29 percent in 2009, primarily due to non-EU countries decreasing their imports of Indiana goods. The euro zone countries have consistently imported the bulk of EU-imported products; in 2010, these countries commanded their largest share yet at 77 percent, or $5.9 billion. Figure 3 shows that the EU began its dramatic increase in imports in 2002, experienced a drawback in 2009 and surged again in 2010. The majority of this growth came from the euro zone countries as evidenced by their 22.4 percent average annual growth rate since 2002. The non-euro zone countries also experienced growth, but have reduced their imports since 2008 to yield an average annual growth of 6 percent since 2002.
Figure 3: Import Trends into the EU, Euro Zone and Non-Euro Zone, 1999-2010

Source: WISER Trade
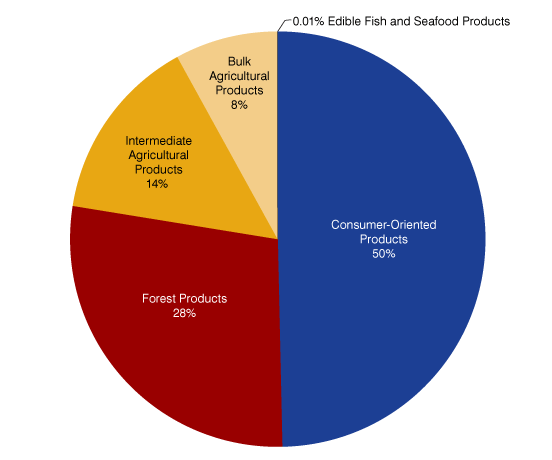
Indiana’s exports of agricultural products to the EU have grown within the past five years, reaching $166.8 million in 2010—a six percent growth over 2009. Similar to the national trends, the majority of Indiana’s agricultural exports are consumer-oriented goods (49.6 percent); however, the second-largest category is forest products (27.9 percent) with intermediate goods and raw products comprising the rest of the exports (14.4 percent and 8 percent, respectively). Surprisingly, dextrins—a low molecular weight carbohydrate used for multiple purposes ranging from food processing, textile finishing and pharmaceuticals—comprised the largest share of exports (34.6 percent). Other sizable exports include wood panel products (including plywood) at 18.7 percent, food preparation products at 10 percent and coarse grains (corn) at 7.4 percent. Figure 4 shows the distribution of Indiana agricultural exports to the European Union in 2010. Mirroring national trends, it is noticeable that half of the exports are already processed before they reach the EU whereas only 8 percent are raw agricultural goods. This may be indicative of Indiana firms also supplying intermediary goods for final goods to be produced within the EU.
Figure 4: Distribution of Indiana Exports to EU, 2010

Notes: Consumer-oriented products include dextrins, food preparation goods, and other intermediary goods used as an additive to other food products; forest products exclude wood pulp and paper; intermediate agricultural products include essential oils, flours, and other products with minimal processing; bulk agricultural products include corn, sugar cane and shelled peas among other bulk goods and the edible fish and seafood products category is self-explanatory..
Source: Foreign Agriculture Service, USDA
Unfortunately, detailed agricultural import data at the state level are not available from FAS; therefore, WISER Trade was used to estimate the value of imports from the EU into Indiana. In 2010, it is estimated that Indiana imported $124 million worth of agricultural goods from the EU, a 2.5 percent increase since 2009. Beverages and tobacco products commanded the largest share of the imports (52.1 percent) followed by food products (37.6 percent). Several agricultural imports have seen strong growth since 2009, including beverages and tobacco products (14.7 percent), wood products (26.5 percent), forestry products (468 percent) and fish products (284.2 percent).
Summary
The European Union is a vital trading partner for both the United States and Indiana for agricultural and non-agricultural products. The European Union’s CAP supports its farmers through subsidies and price supports, of which the U.S. and Indiana likely feel the impact of policy decisions through changes in its imports and exports of agricultural goods. While the U.S. and Indiana are known for their production of raw commodities, the bulk of the agricultural exports are not in raw commodities—rather in processed or intermediary goods. In the future, it is anticipated that the U.S. and EU will remain neck and neck in their market share of agricultural exports, but the mix of exports may differ greatly.
Notes
- To learn more about Indiana’s agriculture industry, see www.incontext.indiana.edu/2010/may-june/article3.asp.
- Future CAP budget details can be found at http://ec.europa.eu/agriculture/cap-post-2013/index_en.htm.
- The most recent agricultural statistics were obtained from the USDA 2010 Ag Statistics Report, www.nass.usda.gov/Publications/Ag_Statistics/2010/Chapter09.pdf.
- More U.S. facts can be found at www.ers.usda.gov/StateFacts/US.htm.
- More basic state facts can be found at www.ers.usda.gov/StateFacts/IN.htm.
- To learn more about the EU agriculture industry, see http://epp.eurostat.ec.europa.eu/cache/ITY_OFFPUB/KS-ED-10-001/EN/KS-ED-10-001-EN.PDF.
- To learn more, see http://ec.europa.eu/agriculture/publi/map/index_en.htm.
- Due to the USDA having the most comprehensive data for raw agricultural trade activity, this data was combined with WISER Trade data with adjustments made to avoid duplicate reporting for agricultural products.
- The $8.9 million figure only includes consumer-oriented, intermediate and bulk goods exports. To include forest and fish products, this value would increase to $10.9 million.
- To learn more, visit http://epp.eurostat.ec.europa.eu/cache/ITY_OFFPUB/KS-GI-10-002/EN/KS-GI-10-002-EN.PDF.
Tanya J. Hall
Economic Research Analyst, Indiana Business Research Center, Indiana University Kelley School of Business
This research was supported by a grant from the European Union.
