Where Are the Kids? Indiana Households with Children
Indiana was one of a handful of states in the Midwest and Northeast to have more children in 2010 than in the previous decade.1 Deeper analysis of new Census 2010 results show that those Indiana children are concentrated in fewer households.
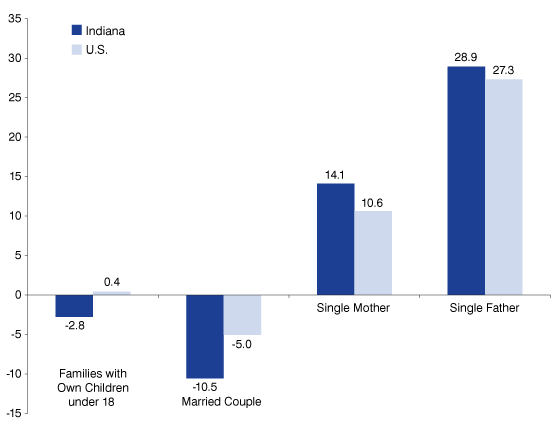
We know this because Indiana saw a 2.8 percent drop in family households with children under 18 between 2000 and 2010, equivalent to 21,119 fewer households with kids. One might expect this since more and more Baby Boomers are becoming empty nesters. However, the U.S. saw a 0.4 percent increase in the number of households with children.
Family Composition
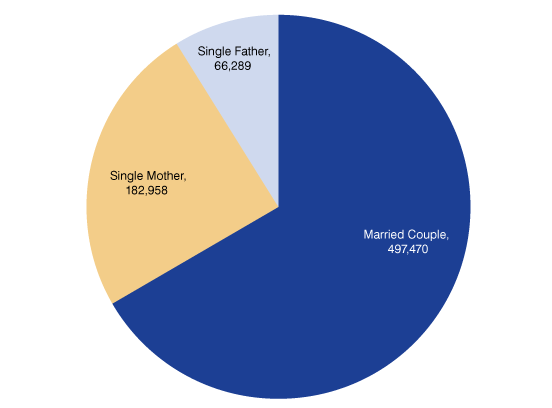
Of the 746,717 Indiana households with children under 18 years of age, 67 percent were married couple households, nearly 25 percent were female householders with no husband present and 9 percent were male householders with no wife present (see Figure 1).2 For the sake of convenience, we will refer to these as single mothers and single fathers; however, one must keep in mind that these categories do not necessarily mean there are no other adults in the household, and cohabiting couples fall within these categorizations.
Figure 1: Families with Own Children under 18 in Indiana, 2010

Source: IBRC, using Census Bureau data
In fact, nearly half of the single-father households include an unmarried partner. This figure is just 20 percent for single-mother households (see Table 1).
Table 1: Single Parent Households with Unmarried Partners, 2010
| Type | All Single-Parent Households | Single-Parent Households that Include an Unmarried Partner | Percent of Single-Parent Households with Unmarried Partners |
|---|---|---|---|
| Female Householder | 182,958 | 36,927 | 20% |
| Male Householder | 66,289 | 31,815 | 48% |
Source: IBRC, using Census Bureau data
Since Census 2000, both Indiana and the United States have experienced a decline in the number of married couple households with children (see Figure 2). Indiana now has 58,643 fewer married couple households with kids, while the number of single-mother households in the state grew by 22,647 and single-father households increased by 14,877.
Figure 2: Percent Change in Households with Children, 2000-2010

Source: IBRC, using Census Bureau data
Remember that those “single-parent” figures include cohabiting couples. Data limitations prevent us from calculating the growth in unmarried couples with children, but we do know that the total number of cohabiting couples increased by almost 48,000 (38 percent) in Indiana and by 41 percent in the United States between 2000 and 2010.
Families across the State
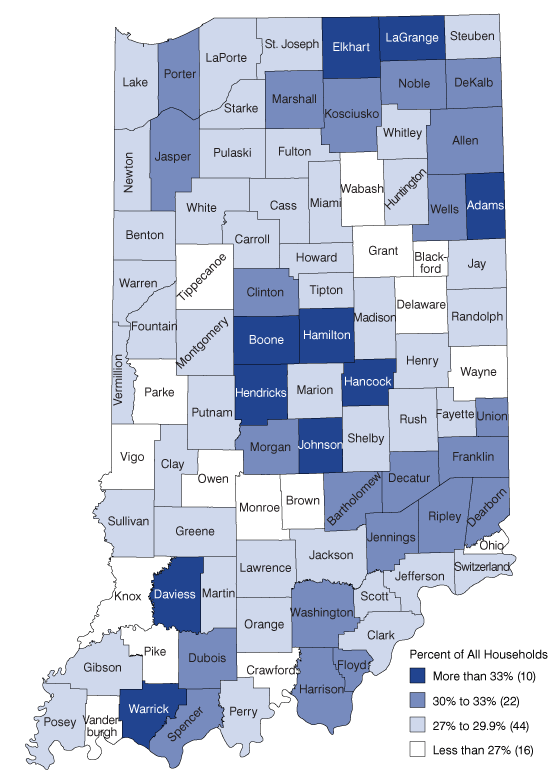
Hamilton County has the most families with children—41.6 percent of all households in that county are comprised of families with children. Figure 3 shows that five of the counties with the highest proportion of families with kids are Indianapolis suburban communities.
Figure 3: Families with Children as a Percent of All Households, 2010

Source: IBRC, using Census Bureau data
At the opposite end of the spectrum, we find less than a quarter of households in Monroe, Brown, Delaware and Ohio counties are families with children. Monroe and Delaware counties are undoubtedly impacted by the large student populations at Indiana University and Ball State, while Ohio and Brown counties have older populations.
Learn More
More detail about Indiana households can be found in the 2010 Demographic Profile on STATS Indiana's Census Topic Page.
Notes
- Matt Kinghorn, “Census 2010: Children = Diversity,” InContext, July–August 2011, www.incontext.indiana.edu/2011/july-aug/article1.asp.
- The Census Bureau tracks data on “own” children as well as “related” children. All data in this article refer to the presence of the householder's own children.
Rachel Justis
Geodemographic Analyst, Indiana Business Research Center, Indiana University Kelley School of Business
