Digging Deeper into the Innovation Index
Recently updated, the Innovation Index is a metric of regional capacity for innovation.1 The present analysis digs a little deeper and examines the relationships between the index's innovation input components and innovation performance (or output) measures for both U.S. counties and Indiana metro areas.
Innovation Sub-indexes
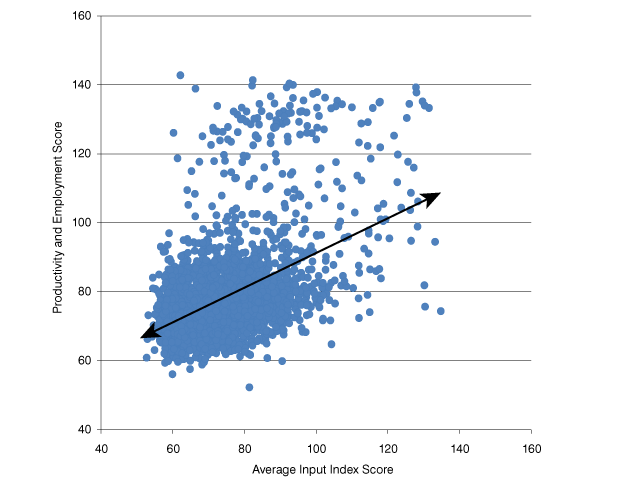
The Innovation Index, available at www.statsamerica.org/innovation/, is composed of four sub-indexes covering different facets of innovation, each warranting analysis in their own right. The Human Capital and Economic Dynamics sub-indexes were designed as "inputs" to innovation. The Productivity and Employment index and the Economic Well-Being index were designed as "outputs" of innovation. It seems natural, then to examine how well the inputs predict the outputs. Figure 1 plots the Productivity and Employment scores of every county in the United States against the average of the two input scores for the same counties, showing that this output measure is correlated with both input measures. The average of the two input measures explain more than 21 percent of the variance in U.S. counties' Productivity and Employment scores. Separately, the correlations between Human Capital and Productivity and Employment, and between Economic Dynamics and Productivity and Employment, are even higher, 41 percent and 30 percent respectively.
Figure 1: Relationship between Input and Output Indexes—Productivity and Employment

Source: Indiana Business Research Center
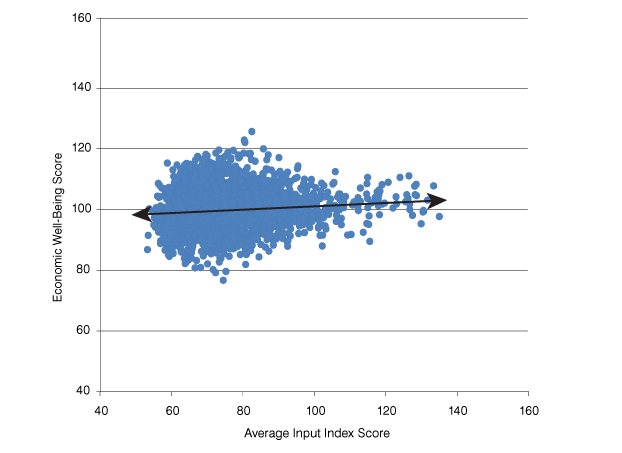
Figure 2 plots the Economic Well-Being scores against the average input index scores. The results are markedly different. There is essentially no relationship between the average input score and Economic Well-Being at the county level. The average Economic Well-Being score sits at about 100 regardless of the input scores and the innovation input measures explains a mere 1 percent of the variance in Economic Well-Being. Breaking apart the input sub-indexes, we can see part of why this is. Economic Well-Being has a predictable positive correlation with Human Capital (19 percent). It's correlation with Economic Dynamics, however, is negative at -5 percent. While these correlations are statistically significant, they pale in comparison to those between the input sub-indexes and Productivity and Employment.
Figure 2: Relationship between Input and Output Indexes—Economic Well-Being

Source: Indiana Business Research Center
These weak relationships are not necessarily bad, however. For one thing, there is just considerably less variance in Economic Well-Being scores than there is in the scores of the other sub-indexes. That makes finding correlations more difficult. At a more substantive level, it is important when constructing an index of something like innovative capacity to use components that account for as much of the phenomenon as possible. Even though it may not be so strongly correlated with the other sub-indexes, Economic Well-Being likely describes aspects of innovation that the others exclude. Conversely, innovation may not have a strong and direct influence on the concepts and measures that make up Economic Well-Being—like per capita personal income, unemployment or poverty rates. Regardless, the weak statistical relationships reported here seem to justify the lower weight given to Economic Well-Being in calculating the overall Innovation Index score. Economic Well-Being contributes 10 percent to the overall score, whereas the other three sub-indexes each contributed 30 percent.
Innovation Index for MSAs
While digging deeper into the Innovation Index, it is also important to examine the index at different levels of geography. Though the index can provide an innovation "score" at the county level, the county probably is not the best geographic unit of measure to evaluate innovation. Counties that are economically interdependent, typically as a result of commuting patterns and transportation linkages—make up a region. One off-the-shelf definition of a region is a Metropolitan Statistical Area (MSA). The index can also be more useful to researchers trying to find relationships with other macro-economic or demographic variables when computed at the MSA level because more types of data are available. Finally, the MSA level of analysis solves one problem with using county-level data to measure innovation—some measures (such as educational attainment) are based upon one's place of residence, while other measures (such as GDP per worker) are based on place of work. Often, workers work in one county and live in another.
The following analysis uses Indiana's MSAs to show how the innovation index is applicable on a regional level and how a region, in contrast to a county, acts as the appropriate geographic unit of analysis.
Table 1 lists the 16 Indiana MSAs and their innovation scores. Compared with the wide-ranging county scores, the MSA scores gravitate to the mean. There are no MSAs in Indiana with overall Innovation Index scores above 100, the national average. The closest is Columbus, with a score of 98.9.
For MSAs made up of several counties, there can be many similarities with the county-level data, depending on how much one county in an MSA dominates the other counties. Monroe County ranked highest in human capital among Indiana counties, and the Bloomington MSA maintains that status, above the national average at 108.9. Note, though, that the Bloomington MSA consists of three counties, and the 108.9 figure is well below the score for Monroe County alone, an impressive 117.9. A similar pull to the mean can be found in the Lafayette MSA. The Human Capital score for Tippecanoe County is above the national average at 103.5, but the aggregate score for the Lafayette MSA is only 97.3.
Table 1: Indiana MSA Innovation Index Scores
| Indiana MSA | Innovation Index | Human Capital | Economic Dynamics | Productivity and Employment | Economic Well-Being |
|---|---|---|---|---|---|
| Columbus | 98.9 | 88.0 | 86.6 | 123.1 | 96.0 |
| Chicago-Joliet-Naperville | 98.5 | 102.9 | 82.3 | 111.5 | 95.4 |
| Lafayette | 95.3 | 97.3 | 88.2 | 100.6 | 94.9 |
| Cincinnati-Middletown | 94.3 | 93.8 | 80.0 | 108.4 | 96.3 |
| Bloomington | 90.7 | 108.9 | 72.3 | 89.6 | 94.2 |
| Indianapolis-Carmel | 88.4 | 105.3 | 80.7 | 76.0 | 98.4 |
| Fort Wayne | 86.4 | 94.9 | 81.7 | 80.9 | 91.6 |
| Kokomo | 85.1 | 80.7 | 76.8 | 97.1 | 87.3 |
| Evansville | 85.0 | 94.2 | 77.1 | 79.2 | 99.0 |
| Louisville/Jefferson County | 83.8 | 86.3 | 78.5 | 81.2 | 100.4 |
| South Bend-Mishawaka | 83.8 | 90.4 | 77.2 | 78.6 | 99.1 |
| Elkhart-Goshen | 82.9 | 70.8 | 82.1 | 92.4 | 92.8 |
| Muncie | 80.6 | 86.8 | 74.8 | 78.1 | 87.2 |
| Terre Haute | 79.6 | 79.0 | 76.8 | 77.2 | 96.9 |
| Anderson | 77.7 | 76.0 | 78.0 | 74.3 | 91.9 |
| Michigan City-La Porte | 75.3 | 72.3 | 75.4 | 73.2 | 90.6 |
Source: Indiana Business Research Center
The fact that the innovation scores gravitate to the mean is not a bad outcome. In fact, it probably shows that the counties that make up the region are, for want of a better term, collaborating. There is something of a geographical tradeoff within MSAs. Consider the example of the Indianapolis-Carmel MSA, which consists of Hamilton County and Marion County (among others). In terms of innovation inputs, Hamilton County has the edge. Hamilton County's Human Capital and Economic Dynamics scores are 120.5 and 109.4, respectively; both exceed the MSA scores by far. Marion County's Human Capital and Economic Dynamics scores are 108.2 and 82.0, respectively.
The output measures tell a different story, however. Hamilton County's Productivity and Employment score is 74.1, and its Economic Well-Being score is 95.1; both are below the MSA scores. Marion County, on the other hand, has scores of 78.1 and 97.8, respectively. The reasons for this flip can be found in the measures that make up these sub-indexes, some of which are shown in Table 2. The percentage of the adult population in Hamilton County with a bachelor's degree or higher is almost twice the national average, whereas Marion County's percentage sits just above the national average. The population of younger workers in Hamilton County has also grown considerably: 3.4 percent between 1997 and 2009, compared with a 0.6 percent drop in Marion County.
Table 2: Select Residence and Employment-Based Measures
| County | Educational Attainment | Productivity | High-Tech Employment | |||
|---|---|---|---|---|---|---|
| Adults with Some College or Associate's Degree* |
Adults with Bachelor's Degree* | GDP per Worker | Average Annual Change in GDP per Worker, 1997-2008 | Average High-Tech Employment Share, 1997-2009 |
Tech-Based Knowledge Occupations | |
| Hamilton | 26.2% | 52.0% | $64,486 | 2.4% | 5.3% | 8.7% |
| Marion | 28.2% | 27.5% | $86,053 | 4.3% | 6.2% | 9.9% |
| U.S. Average | 29.6% | 26.5% | $79,057 | 3.5% | 4.8% | 8.4% |
* Ages 25-64
Source: Indiana Business Research Center
When we shift the focus to employment, however, the advantage swings to Marion County. As mentioned above, population statistics are based on place of residence, whereas employment statistics are based on place of work. Technology-based knowledge occupations in Marion County outstripped those in Hamilton County. Another measure based on place of work, GDP per worker, was more than 33 percent higher in Marion County than in Hamilton County.
A look at Table 2 can make one wonder whether it is Hamilton or Marion County that is the innovation powerhouse. If the decision is based on where brains create rather than where brains sleep, Marion County is the winner.
This is one example of regional patterns. Human capital—a key driver of innovation—congregates in certain geographic corners and travels to other locations in the region to produce the fruits of innovation. In this sense, even though MSA scores on the Innovation Index and sub-indexes obscure some of the differences between counties, the scores are useful in that they can point us to the larger geographic regions that constitute a type of innovation eco-system. The inputs and outputs of innovation may be localized, but they exist in a larger geographic context.
Conclusion
The evidence appears to show that the original design and performance of the index to measure innovation is still valid. There are some weaknesses to the Economic Well-Being sub-index, but its inclusion likely adds more value than it subtracts. Geographically speaking, analyzing innovation at the MSA-level may dull the ability to find an innovation hot spot, but it enhances the knowledge one can gain by illuminating the way that counties interact to innovate and reap the rewards of innovation.
Notes
- Timothy Slaper and Rachel Justis, “Measuring Regional Capacity for Innovation,” InContext, January-February 2010, www.incontext.indiana.edu/2010/jan-feb/article1.asp.
Ryan Krause
Research Assistant, Indiana Business Research Center, Indiana University Kelley School of Business
