Roller Coaster Employment: A Look at Before, During and After the Recession
It is approaching two years since the official end of the recession in June 2009. The Great Recession, as it is commonly known, lasted 18 months from December 2007 to June 2009. It has been described as the deepest and longest recession of the past half century and one which will be remembered for many years to come. This article explores how employment in Indiana and its neighbors changed in the 18 months before, during and after the recession.1
Employment
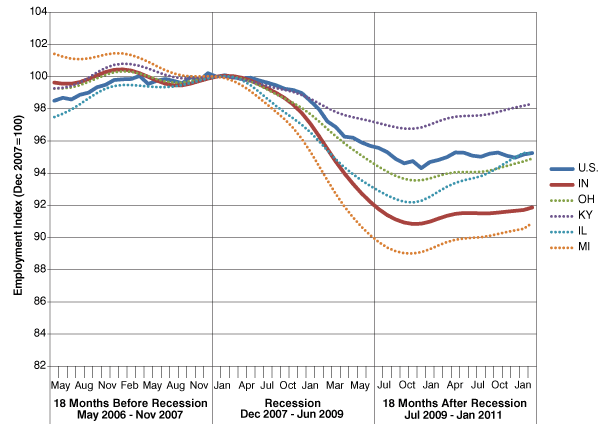
Employment in Indiana and among most states declined steadily during the recession and bottomed out at 2.803 million in November 2009. Employment has increased since then, reaching nearly 2.835 million as of January 2011. Among Indiana’s neighbors, Michigan surpassed Indiana in terms of relative employment losses since the recession began; meanwhile, Kentucky was the only neighboring state to perform better than the U.S. average (see Figure 1).
Figure 1: An Employment Index, May 2006 to January 2011

Source: IBRC, using Bureau of Labor Statistics data
Unemployment
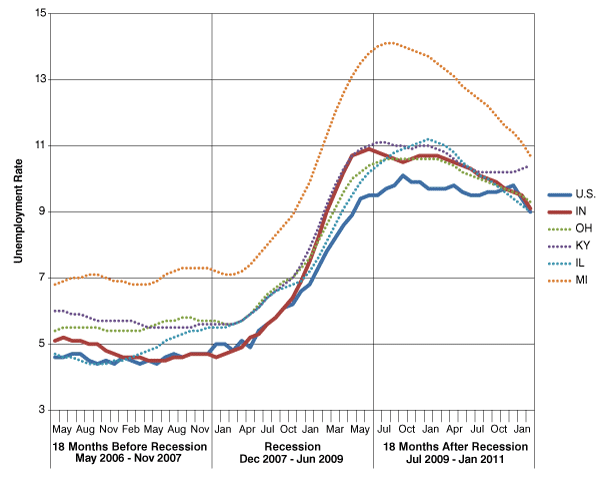
Employment (and unemployment) is a lagging indicator, which means it takes several months to see changes in the indicator once the economy has changed. Figure 2 illustrates this, with unemployment rates staying low for the first part of the recession and only later beginning to climb. Indiana began the recession with low unemployment rates, comparable to the U.S. average, but rose during the recession to levels more consistent with its neighbors.
Figure 2: Unemployment Rates, May 2006 to January 2011

Source: IBRC, using Bureau of Labor Statistics data
The number of unemployed Hoosiers peaked in May 2009 at 347,098 (that's 132 percent higher than in December 2007) and has since been trending downward. As of January 2011, the number of unemployed Hoosiers (285,396) was still 91 percent higher than at the beginning of the recession. Looking across the nation and the Midwest, even through things have been improving, there is still a ways to go before we reach the unemployment levels seen prior to the recession (see Table 1).
Table 1: Average Unemployment Rates Before and After the Recession
| Time Frame | U.S. | IN | OH | KY | IL | MI |
|---|---|---|---|---|---|---|
| 18 Months Before Recession May 2006 - Nov 2007 |
4.6% | 4.8% | 5.6% | 5.7% | 4.8% | 7.0% |
| 18 Months After Recession Jul 2009 - Jan 2011 |
9.7% | 10.3% | 10.2% | 10.6% | 10.4% | 12.8% |
Source: IBRC, using Bureau of Labor Statistics data
Labor Force
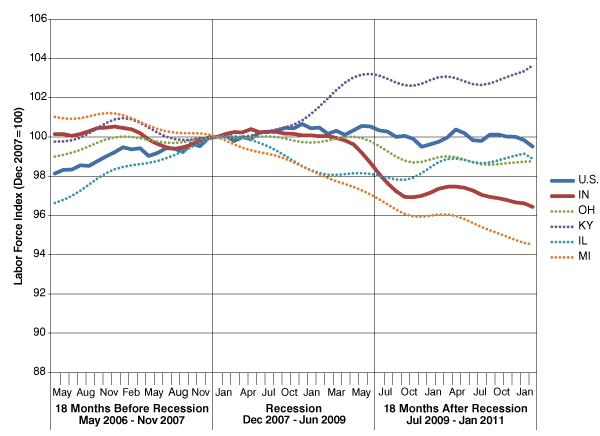
The labor force includes all those who are employed or who are unemployed but looking for work. In Indiana, the labor force really didn't start declining until the very end of the recession, but in Michigan it was declining even before the recession began (see Figure 3). Meanwhile, Kentucky is unique among Indiana's neighbors in that the size of its labor force actually increased during the recession and now surpasses pre-recession levels.
Figure 3: Labor Force Index, May 2006 to January 2011

Source: IBRC, using Bureau of Labor Statistics data
Summary
This article provided a quick glimpse of employment in our region during the last five years. The recession hit workers in Indiana and its neighbors hard. While employment is beginning to rise, it's only the beginning of a long recovery.
Notes
- All data in this article are seasonally adjusted Local Area Unemployment Statistics available from www.hoosierdata.in.gov or www.stats.indiana.edu/topic/laus.asp
Rachel Justis
Geodemographic Analyst, Indiana Business Research Center, Indiana University Kelley School of Business

