Indiana's Wood Products Manufacturing Industry
Although Indiana appears to be a state full of corn and soybean fields, some readers might be surprised to learn that 20 percent of our land area is devoted to forestland (4.65 million acres). Indiana’s forestland and wood product manufacturing is estimated to have a $17 billion economic impact on the state (2005 estimate),1 due in part to the production of high-quality hardwoods, especially oak and hickory, which comprise 73 percent of all Indiana forests. This article will describe the wood products industry in Indiana by detailing the trends in employment, establishments, earnings and trade for this important industry.
Indiana Forestland
At its peak, forestland covered 85 percent of Indiana’s land (in 1800) before clearings for agriculture, community development and infrastructure began. By 1860, Indiana’s forests looked much like they do today. As of 2008, 84.1 percent of the forestland is privately owned by 225,000 landowners, mostly farmers. The remaining 15.9 percent is split between federal, state and county ownership. Unsurprisingly, the majority of the harvested timber occurred on privately held land in 2008 (93.7 percent), yet according to the U.S. Forest Service, current tree growth is estimated to be 1.5 times faster than the current rate of tree harvest. In fact, the state has nearly 2.2 billion trees in its forestland, with Eastern soft hardwoods2 (24.4 percent) and hard maples (16.4 percent) being the top two species.
The Forest Industry and Its Sectors
The forestry industry is typically classified into two manufacturing sectors, primary and secondary wood products, based on the products made and the value added by the industry. Ancillary industries are also covered as they are related to the hardwood industry but not directly a part of the two main sectors. Table 1 shows a breakdown of each sector based on the North American Industry Classification System (NAICS). Table 2 shows the number of establishments and employees in each manufacturing sector in Indiana.
Table 1: Breakdown of Manufacturing Sectors in the Wood Products Industry
| Sector | NAICS | Description |
|---|---|---|
| Primary | 113110 | Timber Tract Operations |
| 113210 | Forest Nurseries and Gathering of Forest Products | |
| 113310 | Logging | |
| 321912 | Cut Stock, Resawing Lumber, and Planing | |
| 321113 | Sawmills | |
| 321114 | Wood Preservation | |
| 321211 | Hardwood Veneer and Plywood Manufacturing | |
| 321212 | Softwood Veneer and Plywood Manufacturing | |
| 321213 | Engineered Wood Member (except Truss) Manufacturing | |
| 321214 | Truss Manufacturing | |
| 321219 | Reconstituted Wood Product Manufacturing | |
| Secondary | 321911 | Wood Window and Door Manufacturing |
| 321918 | Other Millwork (including Flooring) | |
| 321920 | Wood Container and Pallet Manufacturing | |
| 337110 | Wood Kitchen Cabinet and Countertop Manufacturing | |
| 337121 | Upholstered Household Furniture Manufacturing | |
| 337122 | Nonupholstered Wood Household Furniture Manufacturing | |
| 337127 | Institutional Furniture Manufacturing | |
| 337129 | Wood Television, Radio, and Sewing Machine Cabinet Manufacturing | |
| 337211 | Wood Office Furniture Manufacturing | |
| 337212 | Custom Architectural Woodwork and Millwork Manufacturing | |
| 337215 | Showcase, Partition, Shelving, and Locker Manufacturing | |
| 337920 | Blind and Shade Manufacturing | |
| 321999 | All Other Miscellaneous Wood Product Manufacturing | |
| Ancillary | 115310 | Support Activities for Forestry |
| 321991 | Manufactured Home (Mobile Home) Manufacturing | |
| 321992 | Prefabricated Wood Building Manufacturing | |
| 339995 | Burial Casket Manufacturing | |
| 423210 | Furniture Merchant Wholesalers | |
| 423310 | Lumber, Plywood, Millwork, and Wood Panel Merchant Wholesalers |
Source: IBRC, using definitions from the Louisiana Forest Products Development Center
Table 2: Indiana Establishments and Employment by Manufacturing Sector, 2009
| Manufacturing Sector | Number of Establishments | Number of Employees |
|---|---|---|
| Primary | 276 | 4,565 |
| Secondary | 794 | 22,849 |
| Ancillary | 216 | 7,441 |
Source: IBRC, using QCEW, Hoover's and other commercial databases
Primary Wood Products
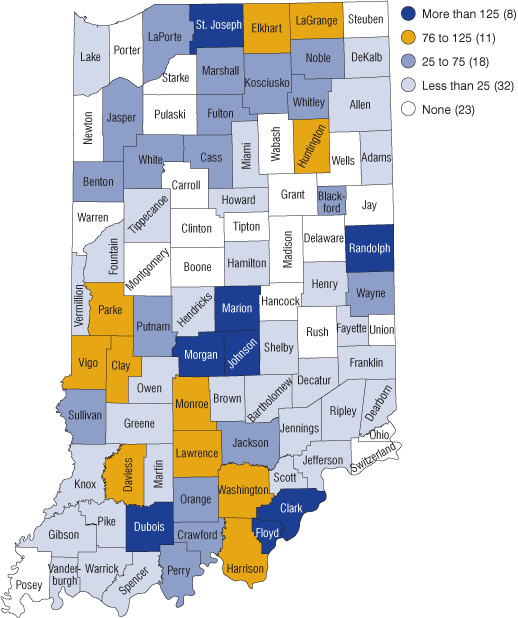
The primary wood products sector is comprised of firms that harvest, transport, and performs the initial processing of logs. In 2009, Indiana had 276 of these firms with 4,565 employees that earned an average annual wage of $32,448. These jobs are located throughout Indiana, with the top three employing counties being Johnson, Floyd, and Clark County. Figure 1 shows the dispersal of primary wood product employment in Indiana.
Figure 1: Primary Wood Products Employment by County, 2009
Note: 2009 data are preliminary.
Source: IBRC, using QCEW, Hoover's and other commercial databases
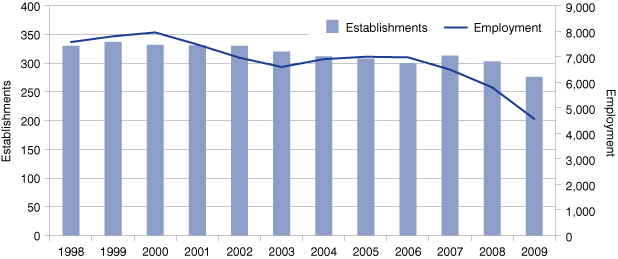
Since 1998, this sector has gradually declined in terms of number of establishments and employees (see Figure 2). All the industries in the primary wood products sector have experienced a slight decline as well, with a slight uptick in employment in 2005 through 2006 for truss manufacturing, logging and engineered wood member manufacturing. As expected, these industries were affected by the recession, with truss manufacturing having the most dramatic impact to its employment (-45.7 percent change from 2007 to 2009).
Figure 2: Primary Wood Products Trends, 1998 to 2009
Note: 2009 data are preliminary.
Source: IBRC, using QCEW, Hoover's and other commercial databases
Secondary Wood Products
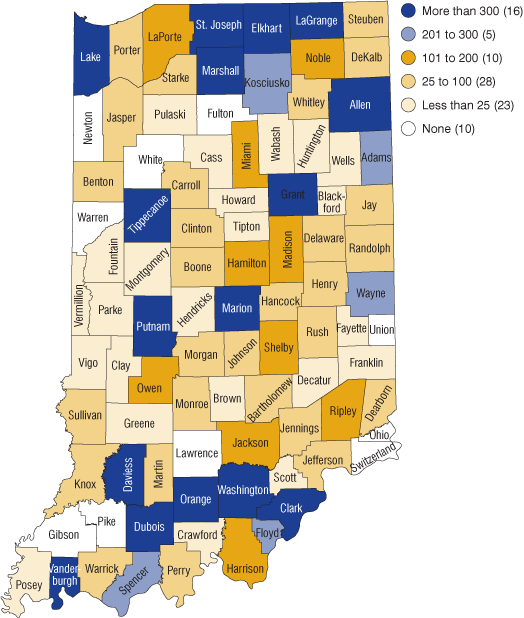
The secondary wood products sector includes businesses that further add value to wood by drying, planing, cutting and assembling wood products into parts or finished products. In 2009, Indiana had 794 of these businesses that employed 22,849 workers at an average wage of $32,640. Dubois County is the hub of secondary wood production in Indiana with around 6,100 employees, followed by Elkhart County (3,483 employees). All other counties have significantly fewer employees in this sector than these two counties, yet nearly every county has some type of secondary wood production (see Figure 3).
Figure 3: Secondary Wood Products Employment by County, 2009
Note: 2009 data are preliminary.
Source: IBRC, using QCEW, Hoover's and other commercial databases
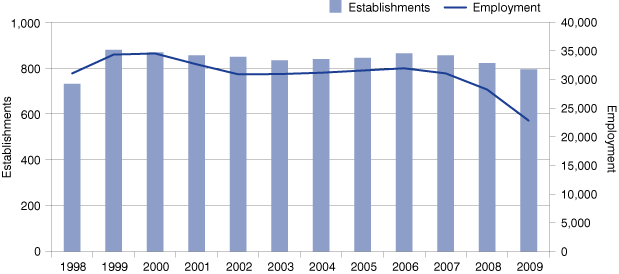
Since 1998, the number of secondary wood product establishments has grown by 8.6 percent; however, the number of employees has declined by 26.4 percent (see Figure 4). Since the 2006 peak, the number of establishments has declined 8.1 percent and nearly a third of the workforce (28.5 percent) has been eliminated. The only two industries with positive changes in employment from the 1998 to 2009 time period were custom architectural woodwork and millwork manufacturing (19.2 percent) and wood kitchen cabinet and countertop manufacturing (2.1 percent). Unfortunately, all other industries have had declines in employment ranging from -6.5 percent (wood container and pallet manufacturing) to -95.3 percent (wood television, radio and sewing machine cabinet manufacturing).
Figure 4: Secondary Wood Products Trends, 1998 to 2009
Note: 2009 data are preliminary.
Source: IBRC, using QCEW, Hoover's and other commercial databases
Ancillary Wood Products
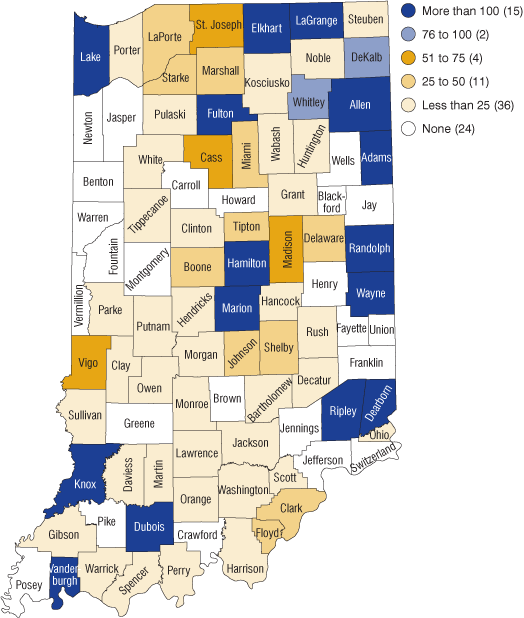
The third sector is comprised of firms that are related to the forest industry but are not directly a part of either the primary or secondary wood product sectors. In 2009, Indiana had 459 firms in the ancillary wood products sector, employing 7,441 workers at an average wage of $44,586. Due to the heavy presence of manufactured home manufacturing and the large number of wholesalers for furniture, lumber, plywood, millwork, and wood panel merchants in Elkhart and Marion counties, these counties lead the state in employment in the ancillary wood product industry (see Figure 5). The next largest employing county is Ripley County due to burial casket manufacturing firms.
Figure 5: Ancillary Wood Products Employment by County, 2009
Note: 2009 data are preliminary.
Source: IBRC, using QCEW, Hoover's and other commercial databases
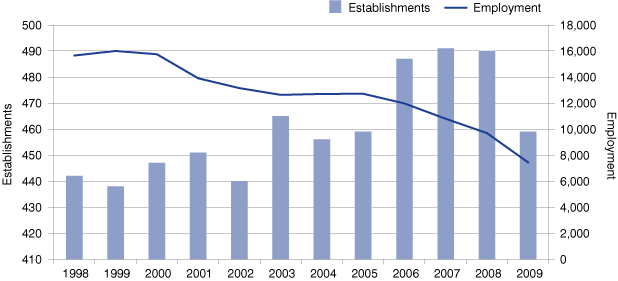
Over time, this industry has seen the number of establishments rise (3.8 percent), yet the total number of employees has declined by 52.5 percent (see Figure 6). A possible reason for these trends could be increasing automation, thus eliminating positions formerly held by individuals. The manufactured home industry experienced a 77.6 percent drop in employment between 1998 and 2009, of which 51.3 percent occurred between 2007 and 2009. All other industries in this sector have experienced declines in employment, but none as severe as in manufactured home manufacturing.
Figure 6: Ancillary Wood Products Trends, 1998 to 2009
Note: 2009 data are preliminary.
Source: IBRC, using QCEW, Hoover's and other commercial databases
Exports of Indiana Wood Products
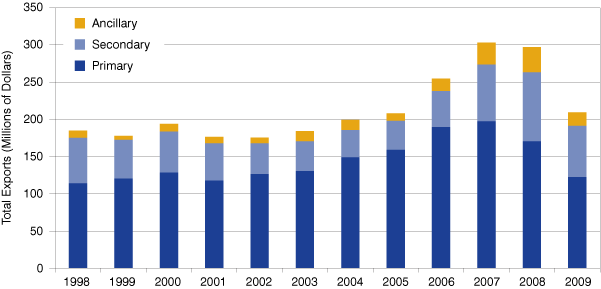
In 2009, Indiana exported nearly $22.9 billion of goods to other countries, down from the peak experienced in 2008 ($26.5 billion), yet still an 85.8 percent increase over 1998’s export value. Of these exports, wood products comprise a small percentage of the overall state exports (0.9 percent in 2009 vs. a peak of 1.5 percent in 1998). Despite the small export percentage in Indiana, it ranked 14th among all states for wood product exports in 2009 with a value of $208.8 million. Figure 7 shows the composition of the exports from Indiana beginning in 1998. The majority of the exports are from the primary wood products sector; however, the secondary wood products industry has steadily increased their exports in the last five years.
Figure 7: Wood Products Exports, 1998 to 2009
Source: IBRC, using Wiser Trade
The top five items exported from the primary and secondary wood products industry are shown in Table 3 (the ancillary wood products industry only has one export). The percentage change reflects the change in export value experienced due to the recession.
Table 3: Top Five Exports per Sector, 2009
| Sector | Wood Product | 2009 | Percent Change from 2008 |
|---|---|---|---|
| Primary | Veneer Sheets Etc., Not Over 6 Mm Thick | $66,799,478 | -30.3% |
| Wood Sawn or Chipped Length, Sliced Etc, Over 6mm Thick | 22,948,480 | -9.6 | |
| Wood in the Rough, Stripped or Not of Sapwood, Etc. | 13,484,827 | -50.1 | |
| Railway/Tramway Sleepers (Cross-Ties), Wood, Nesoi | 5,572,694 | 7.1 | |
| Non-coniferous Wood (Excluding Bamboo) Contour Shaped Along Edges and Ends, Etc. | 3,391,543 | -10.9 | |
| Secondary | Upholstered Seats with Wooden Frames, Nesoi | 11,146,056 | -5.3 |
| Articles of Wood, Nesoi | 11,832,805 | 14.7 | |
| Wooden Furniture, Nesoi | 7,488,834 | -32.8 | |
| Parts of Furniture, Nesoi | 7,971,981 | -46.7 | |
| Wooden Kitchen Furniture, except Seats | 6,654,611 | -19.4 | |
| Ancillary | Prefabricated Buildings | 17,745,838 | -47.3 |
Note: Nesoi stands for not elsewhere specified or indicated.
Source: IBRC, using Wiser Trade
As expected, Canada was the largest trading partner in all wood product sectors in 2009. Other large trade partners with primary wood products were China, Germany, Spain and Mexico. Meanwhile, Australia, Mexico, the United Kingdom and South Korea are large importers of Indiana’s secondary wood products. In the ancillary sector, Pakistan, Egypt, Mexico and the Czech Republic dominate in importing prefabricated buildings. The Indiana State Department of Agriculture and the hardwood industry seek to increase the value of wood products exports and continuously pursue overseas trade mission opportunities, with the most recent trip being to China.3
Conclusions
Indiana’s forests produce high-quality wood that is converted into many different uses ranging from veneer to kitchen tables and much, much more. While Indiana is fortunate to have a productive and high quality stand of forestland, surprisingly our wood products comprise less than 1 percent of the state’s exports. Further effort is needed to increase the exports of Indiana wood products to other countries, thus further enhancing the value it brings to the Indiana economy.
Notes
- See “Indiana’s Hardwood Industry: It’s Economic Impact” for more information at https://www.in.gov/dnr/forestry/files/fo-IHI_economic-impact.pdf.
- Eastern soft hardwoods could include the following species: elm, sycamore, willow, birch, and boxelder.
- D. Massie, “Local Business Reaps Benefits from China Trip,” Pharos-Tribune, June 19, 2010, https://www.pharostribune.com/news/local_news/article_5181c6e6-0027-5e7f-829c-bdef61f2fb01.html.
Tanya J. Hall
Economic Research Analyst, Indiana Business Research Center, Indiana University Kelley School of Business
