Unemployment Rate Is Lower When Education Is Higher
Everyone can benefit from more education, even if the benefits don’t translate directly into dollars and cents. As we’ll see in this article, one big benefit of having more education includes keeping one’s job.
This article focuses briefly on the educational attainment of Indiana’s working age population using the 2009 American Community Survey data (the so-called census long-form replacement).1 Working age in this case includes people between the ages of 25 and 64 — those who are more or less post-college and pre-retirement.
Fifty-five percent of the Hoosier population aged 25 to 64 has had at least some college. If we add to that age group those with a high school diploma (or equivalent), then 89 percent of our population has finished high school. However, that does leave 11 percent of adults in their prime working years without high school credentials (see Table 1).
Table 1: Working Age Population by Educational Attainment, 2009
| Percent of working age population with | Indiana | U.S. |
|---|---|---|
| Some college or higher | 55% | 60% |
| A high school diploma (or equivalent) or higher | 89% | 87% |
| Less than a high school diploma | 11% | 13% |
Source: IBRC, using American Community Survey data
The data reveal several interesting facts about our working age population based on their employment status and educational attainment as it stood in 2009.
First, we see that labor force participation goes up as educational attainment levels increase (see Table 2). Remember that the labor force includes all those who are employed as well as those people who are unemployed but actively looking for work.
Table 2: Participation in the Labor Force by Education Level, 2009
| Category | Indiana | U.S. |
|---|---|---|
| Population 25 to 64 years | 79.4% | 78.7% |
| Less than high school graduate | 59.7% | 62.4% |
| High school graduate (includes equivalency) | 76.8% | 75.2% |
| Some college or associate degree | 82.2% | 81.1% |
| Bachelor's degree or higher | 88.3% | 86.5% |
Source: IBRC, using American Community Survey data
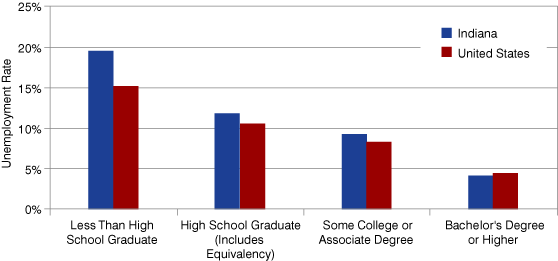
Second, we find that the unemployment rate goes down as educational attainment goes up (see Figure 1).
Figure 1: Unemployment Rate Comparison for the Working Age Population, 2009

Source: IBRC, using American Community Survey data
As shown in Table 3, the unemployment rate for Hoosiers with less than a high school degree was nearly 20 percent, dropping to about 4 percent for those with a bachelor’s degree or higher.
Table 3: Unemployment Rate for Working Age Population by Education Level, 2009
| Category | Indiana | U.S. |
|---|---|---|
| Population 25 to 64 years | 9.5 | 8.4 |
| Less than high school graduate | 19.5 | 15.2 |
| High school graduate (includes equivalency) | 11.8 | 10.6 |
| Some college or associate degree | 9.2 | 8.3 |
| Bachelor's degree or higher | 4.1 | 4.5 |
Source: IBRC, using American Community Survey data
The 2009 American Community Survey contains a wealth of additional data for geographies with at least 65,000 people.2 Visit the Census Bureau’s American FactFinder website at https://data.census.gov/ to learn more.
Notes
- The data used in this article come from the subject table “S2301: Employment Status” on the American FactFinder website.
- The 2005 to 2009 five-year estimates will be released in December 2010 for all geographies down to the block group level, while the 2007 to 2009 three-year estimates will be available for geographies with at least 20,000 people in January 2011.
Carol O. Rogers
Deputy Director, Indiana Business Research Center, Indiana University Kelley School of Business
Rachel Justis
Geodemographic Analyst, Indiana Business Research Center, Indiana University Kelley School of Business
