North-Central Indiana: Realtors Region 2 Profile
This is the second in a InContext Series of Indiana's six Realtors regions. For an overview of this article series and a map of all the regions, see the first article at www.incontext.indiana.edu/2010/may-june/article5.asp.
Geography
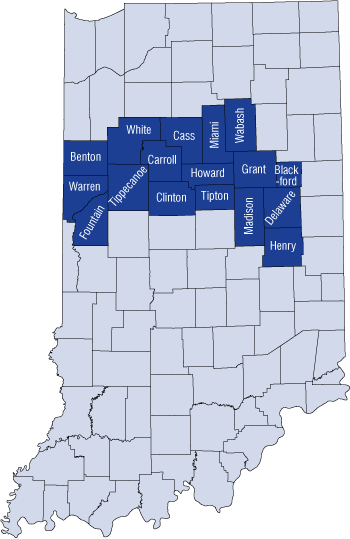
Realtors Region 2, with a 2009 estimated population of 862,000, comprises 17 counties in north-central Indiana: Benton, Blackford, Carroll, Cass, Clinton, Delaware, Fountain, Grant, Henry, Howard, Madison, Miami, Tippecanoe, Tipton, Wabash, Warren and White (see Figure 1). The region covers a land area of more than 6,500 square miles and has a population density of 132 people per square mile, giving residents lots of room.
Figure 1: North-Central Indiana: Realtors Region 2
 Source: IBRC, using the Indiana Association of Realtors definition
Population
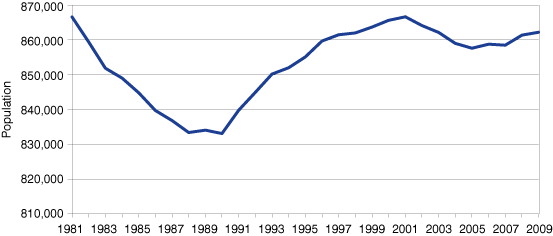
The largest city in Realtors Region 2 is Muncie, with a population in 2009 nearing 68,000. Lafayette came in at a close second, with more than 65,000 people in 2009 (see Table 1). Realtors Region 2 had a total population of 862,185, a decrease from its 2000 population of 865,646 (see Figure 2). The population in Realtors Region 2 is projected to continue declining through 2015 according to the official county population projections from the IBRC.
Table 1: Largest Cities in Region 2, 2009
| Name | Population | Percent of Region |
|---|---|---|
| Muncie | 67,791 | 7.9% |
| Lafayette | 65,704 | 7.6% |
| Anderson | 57,189 | 6.6% |
| Kokomo | 45,396 | 5.3% |
| West Lafayette | 31,530 | 3.7% |
| Marion | 30,418 | 3.5% |
| Logansport | 18,586 | 2.2% |
| New Castle | 18,140 | 2.1% |
| Frankfort | 16,502 | 1.9% |
| Peru | 12,217 | 1.4% |
Figure 2: Region 2 Population Levels, 1981 to 2009

Source: IBRC, using U.S. Census Bureau data
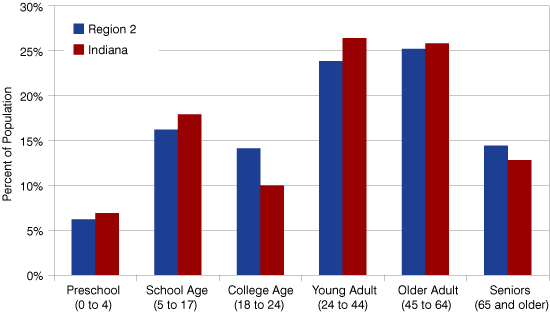
This region has an age mix that differs, sometimes significantly, from the state’s mix (see Figure 3). The most notable difference is in the proportion of college-age people (14.1 percent compared to 10 percent for the state). This is understandable when we consider the location of Purdue University and Ball State University in the region. The age differences also pop out when considering that 14.6 percent of the regional population is 65 and older, compared to the statewide figure of 12.9 percent. One can infer some interesting housing needs in this region, varying from student housing, to family formation, and then retirement.
Among the Realtors regions, Region 2 ranks third in net international migration, with 1,498 more people moving into the region from overseas between 2008 and 2009 than moving out. The region also has a positive rate or natural increase (more births than deaths), but had a net loss of 2,990 people via out-migration to other regions or states in the 2008-2009 time period.
Figure 3: Current Age Structure, 2009

Source: IBRC, using U.S. Census Bureau data
The region is not particularly diverse when it comes to race and Hispanic origin. Ninety-two percent of the population is identified as white, with a small proportion of African-Americans (4.7 percent compared to the state’s 9.2 percent) and Asians (1.6 percent, which is concentrated in Tippecanoe County).
Housing
With an estimated 385,000 housing units, the region ranks fourth among its peers on that measure and third in the number of renter-occupied units (no surprise … just think Purdue!).
Labor Force
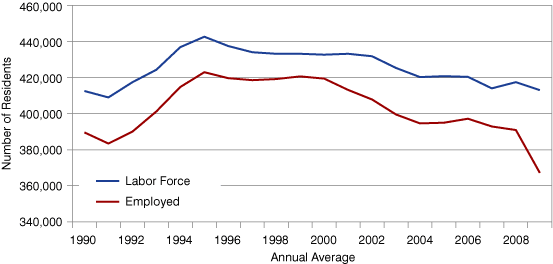
As seen in Figure 4, more than 400,000 residents of the region are part of the labor force: 367,000 people are employed and the remaining 46,000 are actively seeking work (i.e., unemployed). The April 2010 unemployment rate for the region was 10.6, which was 8 percent higher than the state rate of 9.8 for that same month. For a closer inspection of labor force numbers, be sure to visit Hoosiers by the Numbers, the workforce development website of the Indiana Department of Workforce Development. These numbers come out monthly and previous months are revised.
Figure 4: Region 2 Resident Labor Force and Employment

Source: IBRC, using Indiana Department of Workforce Development data
Work
The vast majority of residents work in private industry or in what are called “nonfarm” jobs. The largest sectors include manufacturing, retail, and health care and social services. Recent news articles show that this region also has jobs springing up in wind energy businesses, with large wind farms now appearing in White and Benton counties. These wind farms provide a rare treat for those traveling I-65 and in need of some visually awe inspiring sights; recent news has the town of Fowler in Benton County considering a tourist facility providing information about the wind farms that would provide classrooms and banquet facilities.1
Table 2: Realtors Region 2 Jobs by Industry, 2008
| Industry | Jobs | Jobs LQ |
|---|---|---|
| Total | 321,475 | 0.99 |
| Manufacturing | 64,964 | 2.03 |
| Retail Trade | 39,196 | 1.07 |
| Health Care and Social Services | 36,181 | 0.81 |
| Accommodation and Food Services | 28,001 | 0.99 |
| Public Administration | 14,684 | 0.83 |
| Construction | 11,913 | 0.69 |
| Educational Services | 10,911 | 0.35 |
| Administrative, Support and Waste Management | 10,165 | 0.49 |
| Finance and Insurance | 9,319 | 0.58 |
| Wholesale Trade | 8,992 | 0.63 |
| Other Services (Except Public Administration) | 8,678 | 0.81 |
| Transportation and Warehousing | 7,222 | 0.54 |
| Professional, Scientific, and Technical Services | 7,069 | 0.39 |
| Information | 3,735 | 0.51 |
| Arts, Entertainment, and Recreation | 3,471 | 0.67 |
| Real Estate and Rental and Leasing | 3,375 | 0.63 |
| Management of Companies and Enterprises | 1,497 | 0.34 |
| Agriculture, Forestry, Fishing and Hunting | 1,148 | 0.41 |
| Utilities | 546 | 0.32 |
| Mining | 93 | 0.06 |
Note: The employment numbers for some industries may be low due to nondisclosable data at the county level.
Source: IBRC, using U.S. Bureau of Labor Statistics
Industry Clusters
Clusters can be a valuable way to organize our thinking about industry mix in an area. The Purdue Center for Regional Development has identified 17 clusters that give insight into the core industries and their supplier industries. The idea is to consider what the employment is for such clusters and the number of establishments that work in that cluster and in a particular region. Table 3 shows these clusters for Region 2.
In using the table, it’s worthwhile to consider the actual number of establishments shown. We always want to know “volume” or just plain “how many.” But of equal value is the location quotient (LQ) provided in the column next to the number of firms. Anything over 1.0 means the region has export capacity—exporting to their neighbors in another region, another state, across the nation or around the globe. The idea of having “more than we need” indicates that those clusters are serving needs outside the region as well as within its borders. In short, having an LQ higher than one is good; if it is a lot higher than one (as in, say, primary metals), then the cluster is quite strong.
If clusters have piqued your interest, go to www.statsamerica.org/innovation to see the data in action.
Table 3: Realtors Region 2 Industry Clusters, 2008
| Description | Cluster Establishments | Industry Cluster Establishment LQ |
|---|---|---|
| Total All Industries | 17,485 | 1.00 |
| Business and Financial Services | 1,999 | 0.74 |
| Energy (Fossil and Renewable) | 1,225 | 1.06 |
| Biomedical/Biotechnical (Life Sciences) | 810 | 1.90 |
| Transportation and Logistics | 582 | 1.47 |
| Agribusiness, Food Processing and Technology | 563 | 2.02 |
| Information Technology and Telecommunications | 548 | 0.66 |
| Manufacturing Supercluster | 477 | 1.77 |
| Arts, Entertainment, Recreation and Vistor Industries | 470 | 0.92 |
| Advanced Materials | 452 | 1.66 |
| Education and Knowledge Creation | 421 | 1.11 |
| Defense and Security | 380 | 0.65 |
| Forest and Wood Products | 358 | 0.94 |
| Printing and Publishing | 261 | 0.68 |
| Fabricated Metal Product Manufacturing | 190 | 1.61 |
| Chemicals and Chemical Based Products | 157 | 1.16 |
| Machinery Manufacturing | 122 | 2.08 |
| Apparel and Textiles | 107 | 0.67 |
| Transportation Equipment Manufacturing | 84 | 2.81 |
| Glass and Ceramics | 76 | 1.81 |
| Primary Metal Manufacturing | 36 | 3.11 |
| Mining | 36 | 1.55 |
| Computer and Electronic Product Manufacturing | 30 | 0.82 |
| Electrical Equipment, Appliance and Component Manufacturing | 15 | 1.06 |
Source: IBRC, using U.S. Bureau of Labor Statistics and Purdue Center for Regional Development data
Time to Explore
We hope to have given you a fast trek through the numbers for Realtors Region 2. We could go on, but then that might spoil your fun in going to STATS Indiana’s IN Depth Profiles and learning more about this region or the whole host of regions we have available.
Notes
- Associated Press, “Indiana county hopes wind energy, proposed tourism center bring in more visitors,” The Republic, May 29, 2010.
Carol O. Rogers
Deputy Director, Indiana Business Research Center, Indiana University Kelley School of Business
