Indiana Employee Tenure by Industry and Manufacturing Sub-Sector
In which industries are current Indiana workers likely to have spent longer periods of their career? And how do the wages of higher tenured workers compare by industry or by loyalty to the same employer? This article seeks to understand some key issues about employee tenure through use of longitudinal administrative records from the newly created Indiana Workforce and Education Intelligence System (IWIS). After summarizing current trends in employee tenure research and introducing the IWIS database, this study will compare employee tenure and wages in Indiana’s major industries with a focus on manufacturing.
Typical research on employee tenure makes use of the Current Population Survey (CPS)1 to understand the demographic profiles of American workers with different lengths of employment with the same company. Recently, the U.S. Bureau of Labor Statistics found that half of American workers (above age 16) spent 4.1 years or more at the same employer and that older workers 55-64 years old had almost four times higher median tenure than workers aged 25 to 34—9.9 years compared to 2.7 years.2 Further analyzing CPS data over the past 25 years, Craig Copeland at the Employee Benefit Research Institute (EBRI) finds that median tenure decreased for men from 5.9 years to 5.2 years while increasing for women from 4.2 to 4.9 years. Furthermore, the EBRI report shows that tenure in the private sector has remained steady with half of workers having less than 3.9 years of tenure but median tenure among public sector workers has actually increased from 6.0 years in 1983 to 7.0 years in 2008.3
Applying IWIS to Employee Tenure Research
The Indiana Workforce and Education Intelligence System (IWIS) was created in response to the parallel needs and goals of a wide range of adult education and workforce initiatives. It is modeled after the nationally recognized Florida Education and Training Placement Information Program, a data collection and reporting system to provide follow-up data on former students, with comprehensive outcome information for Florida’s education, workforce development and social services programs.4
While IWIS data can be applied to numerous research questions, this study will pay attention to the differences in tenure and wages of Indiana workers by the 20 major industries. Due to their prominent role in the Indiana economy, 21 key manufacturing sub-sectors will also be analyzed utilizing IWIS’ employment data sourced by the Indiana Department of Workforce Development (DWD).
Here, we track a cohort of 2.8 million Indiana workers who were employed for at least one quarter between 2007 through 2008 and earned at least $10,712 over this two-year time period.5 For each of these eight quarters, the IWIS database provided the wages, employer and industry for every job in which the worker was employed within Indiana.6 Similar wage records for this cohort were then obtained for each of the three preceding two-year periods— 2005-2006, 2003-2004 and 2001-2002—to capture the full scope of the IWIS database.7 This study then grouped these wage records to create four levels of employee tenure depending on the number of two-year periods for which a worker was employed within the state. Unsurprisingly, records for all 2.8 million workers are only available in the most recent 2007-2008 time period since we expect that not all of these workers were employed in previous years. Table 1 summarizes the time frames and available data for the 9 million wage records analyzed for this study.
Table 1: IWIS Employee Tenure Study Data Available by Time Period
| Time Period | Records | Percent of 2007-2008 Cohort |
|---|---|---|
| 2007-2008 | 2,811,071 | 100.0% |
| 2005-2006 | 2,358,936 | 83.9% |
| 2003-2004 | 2,026,893 | 72.1% |
| 2001-2002 | 1,788,301 | 63.6% |
| Total | 8,985,201 | N/A |
Source: IBRC, using data from the Indiana Workforce and Education Intelligence System (IWIS)
While many workers held two or more jobs simultaneously, the study determined a worker’s primary industry and employer within each time period as the industry (and employer within that industry) in which the worker earned the most income.8 For example, if a worker from our 2007-2008 focal group earned the most income from a company in the manufacturing industry, manufacturing would be considered her primary industry and she would have, at minimum, between zero to two years of tenure in that industry. However, if manufacturing was also her primary industry in 2005-2006 but prior to that she worked in a different industry, then she would be coded as having between two and four years of tenure in manufacturing. The same logic would apply to her length of tenure at a particular employer.
Comparing Tenure
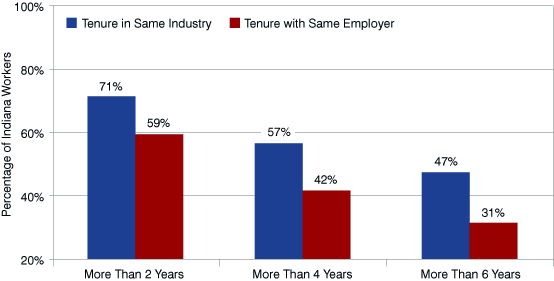
Figure 1 summarizes the overall tenure figures for Indiana workers by industry and by the same employer within an industry. We see that less than half of Indiana employees in the 2007-2008 cohort had been in the same sector for more than six years (i.e., all four of the study periods). Even fewer—less than a third—of these workers had tenure with the same employer for more than six years.
Figure 1: Employee Tenure by Industry and by Employer for 2007-2008 Cohort
Source: IBRC, using data from the Indiana Workforce and Education Intelligence System (IWIS)
Table 2 reveals that utilities and manufacturing had more than 60 percent of their 2007-08 workforce with more than six years of tenure. For manufacturing this is not surprising given that it is generally a shrinking industry and the employees who have been employed the longest are typically the last to be laid off. At the other end of the spectrum, two industries did not have 60 percent of their workers with even two years of tenure, suggesting high levels of turnover linked to these industries. Among these low-tenure industries is the broadly defined administrative and support, waste management and remediation services industry, which includes labor leasing and temporary employment services.
Table 2: Tenure by Industry, 2007-2008 Cohort
| Industry | Number of Employees | Percent by Tenure | |||
|---|---|---|---|---|---|
| 2 Years or Less | More than 2 Years | More than 4 Years | More than 6 Years | ||
| Overall | 2,811,071 | 28.6% | 71.4% | 56.6% | 47.4% |
| Utilities | 18,143 | 14.9% | 85.1% | 74.1% | 65.6% |
| Manufacturing | 619,137 | 17.5% | 82.5% | 70.4% | 62.6% |
| Public Administration | 108,020 | 20.1% | 79.9% | 68.5% | 59.4% |
| Educational Services | 239,016 | 19.3% | 80.7% | 68.0% | 58.7% |
| Finance and Insurance | 112,168 | 23.2% | 76.8% | 63.0% | 53.7% |
| Health Care and Social Assistance | 352,429 | 23.9% | 76.1% | 61.6% | 51.2% |
| Mining | 6,985 | 24.5% | 75.5% | 59.5% | 50.3% |
| Information | 47,253 | 29.5% | 70.5% | 56.6% | 48.5% |
| Construction | 179,252 | 30.1% | 69.9% | 55.5% | 46.5% |
| Wholesale Trade | 134,445 | 30.8% | 69.2% | 52.5% | 42.5% |
| Retail Trade | 292,455 | 34.2% | 65.8% | 49.5% | 39.6% |
| Arts, Entertainment, and Recreation | 34,480 | 35.6% | 64.4% | 47.9% | 37.3% |
| Professional, Scientific, and Technical Services | 102,129 | 35.9% | 64.1% | 45.9% | 36.4% |
| Other Services (Except Public Administration) | 69,443 | 37.2% | 62.8% | 45.4% | 35.5% |
| Transportation and Warehousing | 119,658 | 36.4% | 63.6% | 45.6% | 34.7% |
| Agriculture, Forestry, Fishing, and Hunting | 11,234 | 39.2% | 60.8% | 44.1% | 34.7% |
| Real Estate and Rental and Leasing | 35,574 | 37.7% | 62.3% | 43.6% | 32.8% |
| Accommodation and Food Services | 154,717 | 45.7% | 54.3% | 35.7% | 25.8% |
| Administrative and Support, Waste Management and Remediation Services | 150,519 | 54.4% | 45.6% | 27.3% | 18.8% |
| Management of Companies and Enterprises | 23,819 | 63.1% | 36.9% | 21.8% | 17.2% |
Note: Employment figures may not include workers at employers exempt from unemployment insurance requirements.
Source: IBRC, using data from the Indiana Workforce and Education Intelligence System (IWIS)
Even though people may stay within the same industry, how many are staying with the same employer? IWIS data reveal that just 31 percent of Indiana workers were with the same employer during all four study periods (see Table 3). This ranged from a high of 59 percent in the utilities industry, closely followed by education (54 percent) and public administration (52 percent). These three industries seem to be the most likely to have workers who stay with the same employer throughout their careers.
However, tenure with the same employer is substantially lower for Indiana workers in management of companies and enterprises, accommodation and food services, as well as the broad administrative and support, waste management and remediation services industry. For these industries, almost two-thirds of their employees have less than two years of tenure with the same employer.
Table 3: Tenure with Same Employer by Industry, 2007-2008 Cohort
| Industry | Number of Employees | Percent by Tenure | |||
|---|---|---|---|---|---|
| 2 Years or Less | More than 2 Years | More than 4 Years | More than 6 Years | ||
| Overall | 2,811,071 | 40.6% | 59.4% | 41.7% | 31.4% |
| Utilities | 18,143 | 16.9% | 83.1% | 70.6% | 59.2% |
| Educational Services | 239,016 | 23.0% | 77.0% | 63.2% | 53.6% |
| Public Administration | 108,020 | 26.2% | 73.8% | 61.6% | 52.4% |
| Mining | 6,985 | 28.8% | 71.2% | 50.9% | 41.1% |
| Manufacturing | 619,137 | 31.6% | 68.4% | 50.4% | 38.6% |
| Information | 47,253 | 41.7% | 58.3% | 43.1% | 31.5% |
| Wholesale Trade | 134,445 | 38.1% | 61.9% | 42.5% | 30.8% |
| Finance and Insurance | 112,168 | 38.3% | 61.7% | 41.7% | 30.7% |
| Agriculture, Forestry, Fishing, and Hunting | 11,234 | 43.5% | 56.5% | 39.2% | 29.5% |
| Health Care and Social Assistance | 352,429 | 41.1% | 58.9% | 40.1% | 29.2% |
| Arts, Entertainment, and Recreation | 34,480 | 45.2% | 54.8% | 37.4% | 27.8% |
| Other Services (Except Public Administration) | 69,443 | 44.7% | 55.3% | 36.8% | 26.8% |
| Construction | 179,252 | 46.2% | 53.8% | 36.1% | 26.7% |
| Retail Trade | 292,455 | 46.7% | 53.3% | 34.6% | 25.1% |
| Professional, Scientific, and Technical Services | 102,129 | 44.4% | 55.6% | 35.1% | 23.8% |
| Real Estate and Rental and Leasing | 35,574 | 46.6% | 53.4% | 32.9% | 23.2% |
| Transportation and Warehousing | 119,658 | 46.9% | 53.1% | 32.7% | 22.2% |
| Management of Companies and Enterprises | 23,819 | 66.0% | 34.0% | 18.5% | 13.6% |
| Accommodation and Food Services | 154,717 | 61.7% | 38.3% | 20.2% | 12.9% |
| Administrative & Support, Waste Management and Remediation Services | 150,519 | 65.0% | 35.0% | 18.6% | 10.9% |
Note: Employment figures may not include workers at employers exempt from unemployment insurance requirements
Source: IBRC, using data from the Indiana Workforce and Education Intelligence System (IWIS)
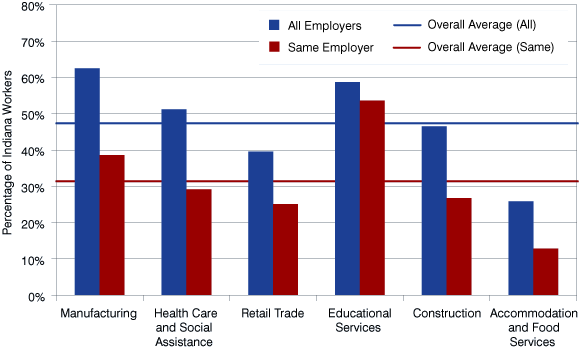
Figure 2 compares industry tenure and employer tenure for the six industries with the most employment by focusing on the proportion of employees with over six years of tenure. Here we see that even though employee tenure is highest overall in manufacturing (63 percent) the education industry stands out given its high levels of tenure not only among all employers (59 percent) but particularly tenure with the same employer (54 percent). This suggests that more educators may spend large amounts of their careers at the same school than factory workers at the same plant within the manufacturing industry.
Conversely, only a quarter of workers in accommodation and food service have more than six years of tenure in the industry and only 13 percent have worked with the same employer for this length of time making accommodation and food service easily the industry with the highest worker turnover.
Figure 2: Comparing Percentage of Indiana Employees with More than Six Years of Tenure for Selected Industries, 2007-2008 Cohort
Source: IBRC, using data from the Indiana Workforce and Education Intelligence System (IWIS)
Comparing Tenure within Manufacturing
Looking within the manufacturing industry, Table 4 shows primary metal, chemical and electrical equipment manufacturing topping the list, with all three of these sub-sectors with over 60 percent of employees with more than six years of experience. At the other end of the spectrum, the three smallest sub-sectors in terms of employment (fewer than 2,000 employees each) also had the shortest tenures and notably almost half of leather and allied product manufacturing workers had two years of tenure or less.
Table 4: Tenure by Manufacturing Sub-Sector, 2007-2008
| Industry | Number of Employees | Percent by Tenure | |||
|---|---|---|---|---|---|
| 2 Years or Less | More than 2 Years | More than 4 Years | More than 6 Years | ||
| Manufacturing Sub-Sector Total* | 619,137 | 23.2% | 76.8% | 61.9% | 52.2% |
| Primary Metal | 52,801 | 18.3% | 81.7% | 70.1% | 63.6% |
| Chemical | 36,179 | 16.2% | 83.8% | 73.5% | 63.1% |
| Electrical Equipment, Appliance, and Component | 13,565 | 19.2% | 80.8% | 67.8% | 60.0% |
| Transportation Equipment | 146,867 | 18.2% | 81.8% | 67.9% | 56.7% |
| Nonmetallic Mineral Product | 16,901 | 21.3% | 78.7% | 64.7% | 55.7% |
| Machinery | 49,614 | 23.0% | 77.0% | 61.9% | 54.1% |
| Computer and Electronic Product | 22,904 | 21.7% | 78.3% | 61.0% | 53.0% |
| Printing and Related Support Activities | 21,207 | 25.5% | 74.5% | 60.2% | 51.9% |
| Paper | 12,512 | 25.2% | 74.8% | 59.1% | 50.6% |
| Miscellaneous | 36,372 | 26.9% | 73.1% | 57.9% | 48.6% |
| Plastics and Rubber Products | 43,422 | 27.3% | 72.7% | 57.4% | 47.0% |
| Beverage and Tobacco Product | 5,002 | 27.6% | 72.4% | 56.4% | 46.4% |
| Furniture and Related Product | 27,773 | 23.5% | 76.5% | 58.7% | 45.5% |
| Fabricated Metal Product | 70,282 | 28.8% | 71.2% | 53.8% | 44.3% |
| Petroleum and Coal Products | 4,713 | 35.2% | 64.8% | 49.5% | 41.3% |
| Wood Product | 18,947 | 30.2% | 69.8% | 51.5% | 41.0% |
| Textile Product Mills | 3,523 | 30.2% | 69.8% | 50.3% | 40.3% |
| Food | 33,511 | 33.2% | 66.8% | 50.3% | 40.2% |
| Textile Mills | 831 | 36.7% | 63.3% | 46.2% | 36.9% |
| Apparel | 1,531 | 35.4% | 64.6% | 43.1% | 30.8% |
| Leather and Allied Product | 680 | 49.6% | 50.4% | 33.2% | 27.4% |
*This row represents the percentage of workers in the manufacturing industry who have worked in the same manufacturing sub-sector for the given time period.
Note: Employment figures represent available may not include workers at employers exempt from unemployment insurance requirements.
Source: IBRC, using data from the Indiana Workforce and Education Intelligence System (IWIS)
While 38 percent of employees in the manufacturing sector had been with the same employer for six years or more, both chemical and nonmetallic mineral product manufacturing have more than half of their workforce with more than six years experience with the same employer (see Table 5). We see the lowest levels of tenure with the same employer in beverage and tobacco product manufacturing where almost two-thirds of workers have been with their current employer for two years or less.
Table 5: Tenure with Same Employer by Manufacturing Sub-Sector, 2007-2008
| Industry | Number of Employees | Percent by Tenure | |||
|---|---|---|---|---|---|
| 2 Years or Less | More than 2 Years | More than 4 Years | More than 6 Years | ||
| Manufacturing Sub-Sector Total* | 619,137 | 31.6% | 68.4% | 50.3% | 38.4% |
| Chemical | 36,179 | 21.4% | 78.6% | 68.6% | 57.7% |
| Nonmetallic Mineral Product | 16,901 | 24.4% | 75.6% | 60.2% | 51.1% |
| Electrical Equipment, Appliance, and Component | 13,565 | 33.6% | 66.4% | 53.7% | 47.1% |
| Computer and Electronic Product | 22,904 | 24.5% | 75.5% | 55.9% | 46.6% |
| Machinery | 49,614 | 26.2% | 73.8% | 56.4% | 45.8% |
| Printing and Related Support Activities | 21,207 | 32.0% | 68.0% | 52.7% | 42.8% |
| Petroleum and Coal Products | 4,713 | 35.6% | 64.4% | 49.2% | 40.0% |
| Plastics and Rubber Products | 43,422 | 31.2% | 68.8% | 50.3% | 39.4% |
| Textile Product Mills | 3,523 | 32.3% | 67.7% | 48.2% | 38.6% |
| Textile Mills | 831 | 36.7% | 63.3% | 46.0% | 36.5% |
| Primary Metal | 52,801 | 23.3% | 76.7% | 55.9% | 35.2% |
| Miscellaneous | 36,372 | 39.0% | 61.0% | 46.2% | 35.1% |
| Transportation Equipment | 146,867 | 32.2% | 67.8% | 47.4% | 35.1% |
| Fabricated Metal Product | 70,282 | 36.2% | 63.8% | 45.0% | 34.7% |
| Furniture and Related Product | 27,773 | 31.3% | 68.7% | 49.4% | 34.3% |
| Food | 33,511 | 39.1% | 60.9% | 44.5% | 32.1% |
| Wood Product | 18,947 | 36.8% | 63.2% | 42.4% | 32.0% |
| Paper | 12,512 | 39.2% | 60.8% | 39.2% | 31.0% |
| Leather and Allied Product | 680 | 49.6% | 50.4% | 32.8% | 26.6% |
| Apparel | 1,531 | 48.7% | 51.3% | 33.2% | 20.3% |
| Beverage and Tobacco Product | 5,002 | 66.0% | 34.0% | 25.4% | 19.4% |
*This row represents the percentage of workers in the manufacturing industry who have worked in the same manufacturing sub-sector for the given time period.
Note: Employment figures may not include workers at employers exempt from unemployment insurance requirements.
Source: IBRC, using data from the Indiana Workforce and Education Intelligence System (IWIS)
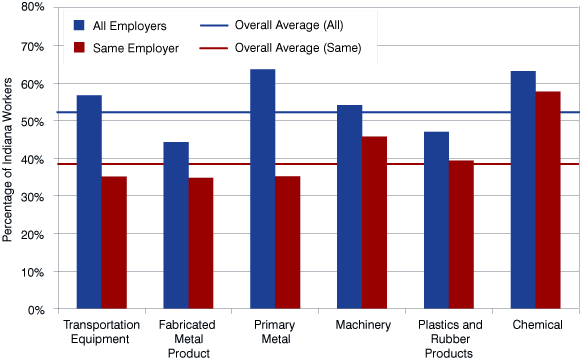
Figure 3 makes a side-by-side comparison of tenure within industry and tenure with the same employer for six manufacturing sub-sectors with high employment. We see that chemical manufacturing is the only sub-sector where more than 50 percent of workers exceeded six years of tenure overall and with the same-employer. Substantially lower levels of tenure with the same employer are noticed for all other sub-sectors particularly in primary metal manufacturing where only 35 percent of workers have more than six years of tenure with the same employer—even though this sub-sector has the highest overall tenure level at 64 percent.
Figure 3: Comparing Percentage of Indiana Employees with More than Six Years of Tenure for Selected Manufacturing Sub-Sectors, 2007-2008
Source: IBRC, using data from the Indiana Workforce and Education Intelligence System (IWIS)
The Tenure-Wage Relationship
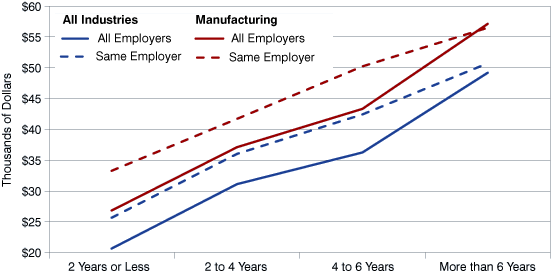
Figure 4 confirms our expectations that employee wages increase with tenure across all industries including the manufacturing sub-sector. We see that while workers with two years of tenure or less earn annual wages of just over $20,000 per year, workers with only slightly more tenure in their industry—between two and four years—earn $31,000 per year, a 50 percent increase. Those exceeding six years of service to their industry earn even more—$49,000. The same pattern is observed for the manufacturing sub-sector though these workers earn higher average wages on average—$27,000 for those in the two years or less category and up to $57,000 for those with more than six years of tenure.
However, while tenure with the same employer generally leads to even higher wages, this is true primarily at lower levels of tenure (six years of tenure or less). Beyond six years of tenure, we do not see substantial wage differences between tenure overall and tenure with the same employer.
Figure 4: Average Annual Wages by Years of Tenure, All Industries Compared to Manufacturing, 2007-2008
Source: IBRC, using data from the Indiana Workforce and Education Intelligence System (IWIS)
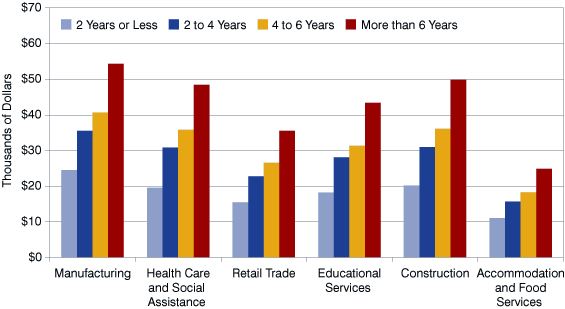
There is a positive wage-tenure relationship among all six of the “high-employment” industries summarized in Figure 5 though increases in wages with tenure were less pronounced in the low-wage accommodation and food service industry. Here, employees with over six years of tenure still only earned annual wages of $25,000. While this amount may be more than double the earnings of accommodation and food service workers with tenure of two years or less, it is barely more than the earnings of the least tenured manufacturing workers.
Figure 5: Average Annual Wages by Years of Tenure for Selected Industries, 2007-2008
Source: IBRC, using data from the Indiana Workforce and Education Intelligence System (IWIS)
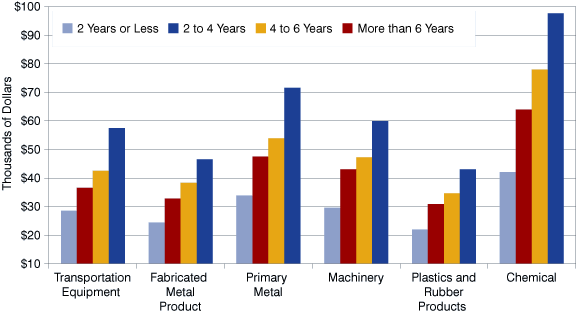
Within manufacturing, the biggest returns to employee tenure are in the chemical manufacturing sub-sector (see Figure 6). Starting with high annual wages of $42,000 for workers with two years of tenure or less, workers with more than six years of tenure earn $97,000 per year—a 131 percent increase. The high wages within this manufacturing sub-sector may help explain why chemical manufacturing has one of the highest levels of employee tenure.
Figure 6: Average Annual Wages by Years of Tenure for Selected Manufacturing Sectors, 2007-2008
Source: IBRC, using data from the Indiana Workforce and Education Intelligence System (IWIS)
Conclusion
This study allows us to understand important differences in employee tenure and gain insight on which industries have more stable employment and long-term income potential for transitional workers. Industries that have longer-tenured employees can have a variety of associated benefits such as a more experienced workforce and greater institutional memory for those whose tenure was at the same employer. There may also be higher costs since higher benefit payments may accompany the higher wages of long-term employees and there could be more resistance to changing technologies among tenured workers if they have not updated their training or engaged in lifelong learning opportunities.
Through IWIS, Indiana researchers expect to learn even more about our workforce as the database grows in breadth, through additional educational and demographic information from partner agencies, and depth, as more years of data are added.
Notes
- The Current Population Survey (CPS) is a monthly survey of 60,000 households jointly administered by the U.S. Bureau of Labor Statistics and the U.S. Census Bureau. More information on labor market information collected by the CPS is available at: www.bls.gov/cps/.
- For more information, please read the Employee Tenure Summary “Employee Tenure in 2008” from the Bureau of Labor Statistics, available at www.bls.gov/news.release/tenure.toc.htm.
- This EBRI report is available at www.ebri.org/pdf/notespdf/EBRI_Notes_01-Jan10.LF-Prtcp.pdf.
- IWIS has received support from the Lilly Endowment, the Joyce Foundation and currently the Lumina Foundation. Partners include the Indiana Department of Workforce Development, the Indiana Commission for Higher Education, the Indiana Department of Education, and the Indiana Business Research Center. More information about Florida’s program is available at www.fldoe.org/fetpip/.
- This two-year time frame ensures that workers who are temporarily employed due to the recession would not be eliminated from the data set, and the $10,712 threshold was selected because it represents the earnings equivalent of one “half-time” minimum wage job—20 hours per week at $5.15 per hour for two years (104 weeks).
- While these data are generally comprehensive, some employment that is not covered by unemployment insurance requirements (including some types of small businesses and family farms) is not available.
- Currently, the IWIS database only contains wage records from 2001 onward. New wage records are added every quarter, and it is possible that historic data (prior to 2001) may be added in the future.
- The industries used in this study are the 20 sectors defined by the North American Industrial Classification System (NAICS). More information about NAICS is available at www.census.gov/cgi-bin/sssd/naics/naicsrch?chart=2007.
Michael F. Thompson
Economic Research Analyst, Indiana Business Research Center, Indiana University Kelley School of Business
Rachel Justis
Geodemographic Analyst, Indiana Business Research Center, Indiana University Kelley School of Business
