Breaking Down the Housing Market
Foreclosures are up and housing prices are down. In all of this turmoil, how is Indiana being affected? Is Indiana's experience similar to what is happening around the country? This brief article focuses on those two issues, in context with the nation and the Midwest.1
Like the nation, Indiana has seen continuing increases in the number of mortgage loans in the foreclosure process. Based on fourth quarter data (2006, 2007 and 2008) from the Mortgage Bankers Association's National Delinquency Surveys, the United States saw an increase in the percentage of all loans in the foreclosure process, moving from 1.2 percent to 3.3 percent. The five-state Midwest region1 also experienced a shift from 2.4 percent to 3.8 percent, while Indiana saw a steady increase in their foreclosure inventory moving from 3.0 percent to 3.8 percent.
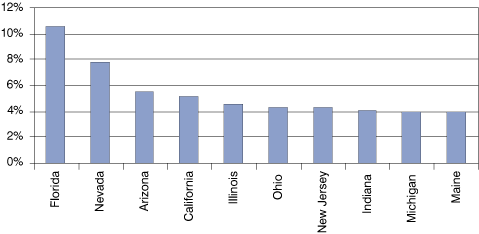
Note that in 2006, Indiana already had a higher proportion of foreclosures and by 2008 was still higher than the nation's 3.3 percent, but now was matched by the Midwest. First quarter 2009 results reveal that four Midwestern states claim spots in the nation's top 10 highest foreclosure inventories (see Figure 1). The Midwest held about 14 percent of all of the U.S. mortgage loans but 16 percent of all loans in the foreclosure inventory.
Figure 1: Percent of State's Mortgage Loans in Foreclosure, 2009:1
Source: IBRC, using data from the Mortgage Bankers Association National Delinquency Survey
The Rise and Fall of Home Prices
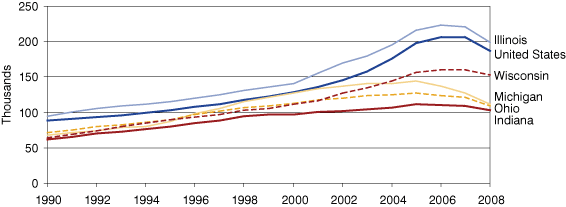
The median sale price for an Indiana single-family home has trailed both neighboring states and the nation overall since 1990 (see Figure 2). Much of the United States, including Indiana, experienced home value appreciation from 1990 to 2005. The average of the median home sale prices in the United States had an average annual growth rate of 5.4 percent. In the Midwest, Indiana and Ohio experienced a 3.9 percent average annual growth during the 15-year span, significantly lower than the national average. While the nation saw prices peak in 2006, Indiana's home prices peaked in 2005. Since its peak, the United States experienced an average annual decline of 4.9 percent in prices, and most of the Midwest region had even higher rates of reduction. Indiana home prices didn't match the escalation of the nation, nor have Indiana home values declined as dramatically—2.4 percent annually since 2005.
Figure 2: Median Sales Price for Single-Family Homes in the Midwest, 1990 to 2008
Source: Moody's Economy.com
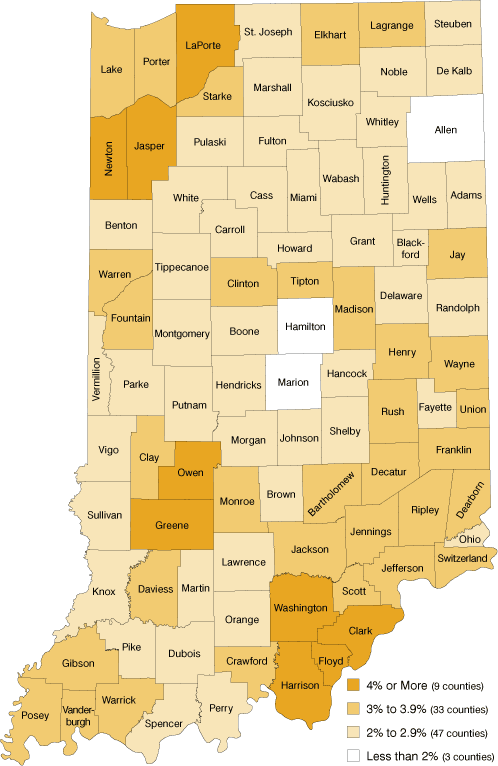
Looking within Indiana, Hamilton, Porter, Hendricks and Hancock counties consistently had the highest median home sale prices between 1990 and 2008, with Monroe and Floyd joining by 2005. Home price growth rates vary throughout Indiana, with higher rates outside of Chicago and Louisville and lower growth in the Indianapolis region (see Figure 3).5
Figure 3: Average Annual Home Price Growth Rate by County, 1990 to 2008
Source: IBRC, using data from Moody's Economy.com
Housing More Affordable, But Fewer Transactions
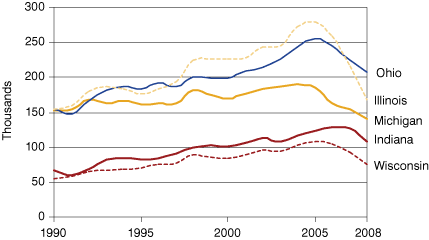
The year 2005 marked not only a turning point for sale prices in the Midwest as a whole, but also corresponded with a decrease in the volume of home sales. Conventional wisdom would indicate that as a house becomes less expensive, the demand for it would increase. The convergence of the housing bust, the financial crisis and rising unemployment has limited demand even though realtors would call this a "buyers market." Figure 4 shows a steady increase in the number of existing single-family homes sold up to 2006, which are followed by continued declines in the volume of transactions.
Figure 4: Existing House Sales (Seasonally Adjusted), 1990 to 2008
Source: Moody's Economy.com
Fewer Starts
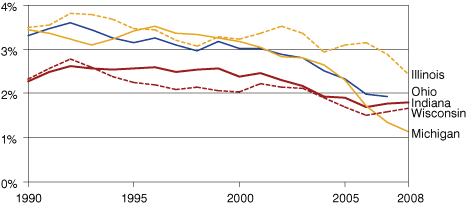
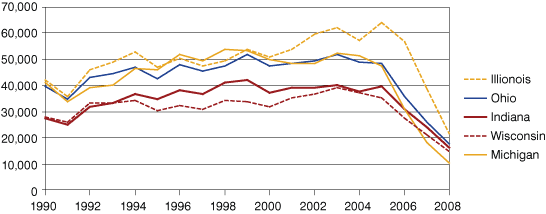
The number of housing starts within the current year can serve as an early warning sign of significant changes in the housing market and the overall economy.6 Indiana and the Midwest experienced housing start peaks in 2003, while the nationwide peak didn't hit until 2005. From 1990 to 2003, the number of housing starts rose in the Midwest (although not at the same pace as the U.S. average) and since 2003 have fallen. Contributing to the decline in the number of Midwest housing starts were demographic shifts. As people moved south and west, the Midwest's share of all U.S. housing starts dropped from 14.9 percent in 1990 to 13.3 percent in 2003 and to 9 percent by 2008. In 1990, Indiana held 2.3 percent of all U.S. housing starts (see Figure 5), dropping to 1.8 percent by 2008. However, Indiana also experienced the smallest percentage decrease in housing starts in the Midwest (see Figure 6). We could say that because Indiana didn't experience the same dramatic gains in home values and housing starts as other parts of the country, it now doesn't suffer the same dramatic losses. That is perhaps small comfort to those in the business of building and selling homes.
Figure 5: Housing Starts as a Percent of U.S. Total, 1990 to 2008
Source: IBRC, using data from Moody's Economy.com
Figure 6: Housing Starts in the Midwest, 1990 to 2008
Source: Moody's Economy.com
Summary
Indiana continues, like most states, to see increases in foreclosures, sluggish home sales, declining housing starts and shrinking home values. But we note two significant trends: First, Indiana has experienced less dramatic price movements in its housing market. The slow rise in prices may be a contributing factor to the continuous high level of foreclosures,7 though the lower rate of decline softens the current crunch. Second, Indiana is increasing its share of U.S. home sales based on recent data, which may mean that Indiana's affordable housing is getting more than second looks.
Notes
- The Midwest region for this article consists of Illinois, Indiana, Michigan, Ohio and Wisconsin.
- Indiana State Government, "The NSP Substantial Amendment," Official Website of the State of Indiana (November 2008), www.in.gov/ihcda/files/NSP_Final_12-18-08.pdf.
- Numbers are not seasonally adjusted; fourth quarter data from each year are used unless noted otherwise.
- This number is the average of the median home sale prices for the 50 states plus the District of Columbia.
- Numbers are current year dollars.
- B. Baumohl, The Secrets of Economic Indicators (Upper Saddle River, New Jersey: Wharton School Publishing, 2008).
- Indiana State Government, "Interim Study Committee on Mortgage Lending Practices and Home Loan Foreclosures," Official Website of the State of Indiana (August 16, 2007), www.in.gov/legislative/interim/committee/2007/committees/minutes/MLHLA8G.pdf.
Suzanne Witmer
Research Assistant, Indiana Business Research Center, Indiana University's Kelley School of Business
