Population and Employment Change in Indiana
Indiana has seen 22 years of uninterrupted annual population growth. Furthermore, since 1991,1 the state has had positive net migration each year with the exception of 2002. While the state's population has grown consistently, this growth has not occurred evenly throughout this period. Most notably, Indiana's lowest population gains in recent years coincided with the recession of the early 2000s.
This last point hints at the primary driver of variation in population growth and migration in Indiana. This article will examine recent population trends in Indiana and the Midwest as well as consider the link between changes in employment and population growth in the state. This relationship could offer clues to Indiana's likely population trends in the near future as the current economic downturn plays out.
Recent Population Trends
According to U.S. Census population estimates Indiana's population grew by 41,000 people between 2007 and 2008 to reach an estimated 6.4 million residents. This total makes Indiana the nation's 16th most populous state. In terms of the rate of growth, the 41,000 new residents represent a 0.65 percent increase over 2007, which exceeds the state's average annual rate of population growth between 2000 and 2008 of 0.57 percent.
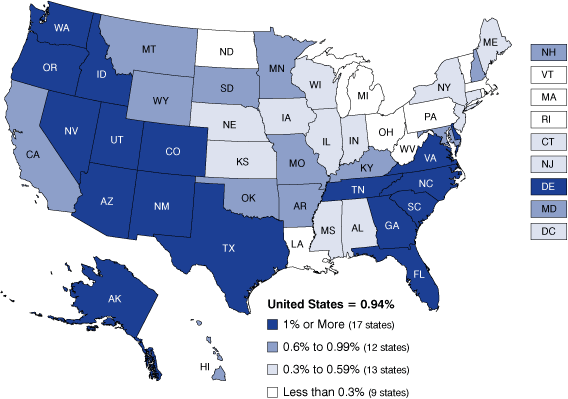
Figure 1 illustrates the familiar trend in population growth rates by state. Between 2000 and 2008, states in the South and the West have experienced the greatest population growth led by Nevada (3.2 percent average annual growth), Arizona (2.9 percent), Utah (2.5 percent) and Georgia (2.1 percent). Indiana's annual growth rate of 0.57 percent ranks 32nd nationally. While this mark is well below that of most Southern and Western states, Indiana's growth rate trails only South Dakota, Minnesota, Missouri and Wisconsin among Midwestern states.2 Indiana has lagged Kentucky's growth rate over this period but has outpaced its Midwestern neighbors—with Illinois, Ohio and Michigan registering average annual growth rates of 0.46, 0.13 and 0.06, respectively.
Figure 1: Average Annual Percent of Population Change, 2000 to 2008

Source: IBRC, using U.S. Census Bureau data
Indiana has outpaced those neighbors by continuing to attract new residents at a time when other states in the region have experienced substantial out-migration. Table 1 details the components of population change for Indiana and its bordering states. Indiana has added 53,000 residents, on net, through migration in this decade. Meanwhile, Michigan has seen a net out-migration of 316,000 people since 2000, which equates to a 3 percent loss in population from this component. Ohio and Illinois have experienced net out-migrations of 250,000 and 159,000 people, respectively. Conversely, Kentucky's net in-migration of 105,000 residents is nearly twice as great as Indiana's. Michigan, Ohio and Illinois have maintained their modest population growth through natural increase (births minus deaths) alone.
Table 1: Components of Population Change for Indiana and its Neighbors, 2000 to 2008
| Population, 2000 | Net Migration, 2000-2008 | Natural Increase, 2000-2008 | Percent Population Change through Net Migration | Percent Population Change through Natural Increase | |
| Indiana | 6,080,522 | 53,231 | 264,562 | 0.9% | 4.4% |
| Illinois | 12,419,660 | -159,182 | 644,967 | -1.3% | 5.2% |
| Kentucky | 4,042,284 | 105,235 | 130,645 | 2.6% | 3.2% |
| Michigan | 9,938,492 | -315,621 | 366,566 | -3.2% | 3.7% |
| Ohio | 11,353,160 | -249,542 | 353,444 | -2.2% | 3.1% |
Source: U.S. Census Bureau
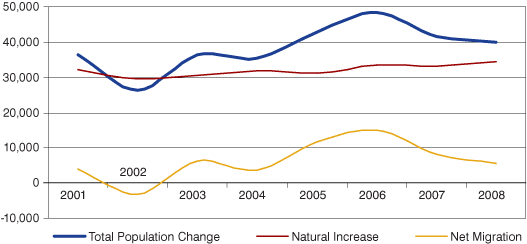
While Indiana has registered positive net migration this decade, its population growth has been spurred primarily by natural increase as well. Figure 2 shows that Indiana's annual population growth has ranged from as low as 26,000 in 2002 to as high as 48,000 in 2006. However, natural increase has been relatively stable over this period and has accounted for as much as 113 percent of the state's annual population growth (2002) and as little as 69 percent (2006). Annual net migration, on the other hand, has fluctuated between -3,300 and 15,000. So, while natural increase has had the dominant influence on population change in the state, it is migration that drives variation in Indiana's population growth. As we will see, migration trends in Indiana, like in many other states, have been closely related to shifts in employment.
Figure 2: Indiana's Annual Population Growth with Components of Change, 2000 to 2008

Source: IBRC, using U.S. Census Bureau data
Employment Change and Migration
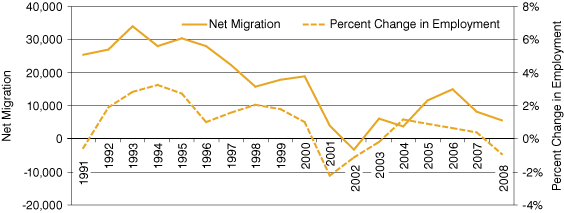
Figure 3 traces Indiana's annual net migration between 1991 and 2008 along with the annual percent change in the state's total nonfarm employment. Over this period, the two variables tended to move together with shifts in the rate of employment change generally signaling a similar shift in the level of net migration. For instance, Indiana's greatest employment boom in recent years occurred between 1993 and 1995 when jobs increased by roughly 3 percent a year. In total, Indiana added 230,000 jobs over this period. These are also the top years for in-migration with an average annual net movement into the state of 31,000 residents. The state continued to add jobs throughout the decade but at a more modest pace. These lower rates of employment growth were accompanied by lower levels of net in-migration.
Figure 3: Indiana's Annual Percent Change in Employment and Net Migration, 1991 to 2008

Sources: U.S. Census Bureau, Moody's Economy.com, Bureau of Labor Statistics
The recession beginning circa 2001 provides another example of this relationship in Indiana. Significant employment losses in 2001 and 2002 coincided with declines in net migration culminating in Indiana's only net out-migration over this period in 2002. Not until employment began to recover in 2004 did Indiana see consecutive years of increased net in-migration.
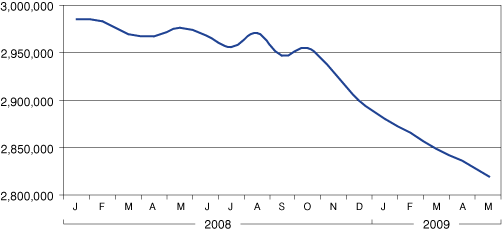
This fairly strong association between changes in employment and migration is important to understand given the current economic downturn. Indiana, like much of the nation, has seen heavy job losses in recent months (see Figure 4). In fact, between May 2008 and May 2009, Indiana lost 156,000 jobs, which exceeds the state's greatest decline during the previous recession (132,600 jobs lost between May 2000 and July 2003).
Figure 4: Indiana's Total Nonfarm Employment, January 2008 to May 2009 (Seasonally Adjusted)

Source: IBRC, using Bureau of Labor Statistics data
If the relationship between employment change and migration holds, it is likely that Indiana will see lower levels of net migration, leading to lower rates of population growth in the near term. There is reason for optimism, however, as Indiana rebounded from the last two recessions to post employment growth and attract new residents. Indiana recovered from the recession of the early 2000s in a way that neighboring Michigan, Ohio and Illinois were unable to do. Given these recent trends, there is reason to believe that after the current economic downturn plays out; Indiana can remain a state that is attractive to employers and prospective residents.
Notes
- 1991 marks the first year that the U.S. Census Bureau tracked net migration as part of its annual population estimates program.
- The U.S. Census Bureau defines the Midwest as consisting of Illinois, Indiana, Iowa, Kansas, Michigan, Minnesota, Missouri, Nebraska, North Dakota, Ohio, South Dakota and Wisconsin.
Matt Kinghorn
Demographer, Indiana Business Research Center, Indiana University's Kelley School of Business
