Indiana's Leading Export Industries
For the past few years, the Indiana Business Research Center has provided reports about Indiana's exports to the Indiana Economic Development Corporation. This article, derived from the 2008 report, focuses on Indiana's exports in three industries: 1) vehicle and parts, 2) industrial machinery and 3) pharmaceutical products. These industries are notable because the vehicle and industrial machinery industries account for the vast majority of Indiana exports, while the pharmaceutical products industry is the fastest growing export industry.1
Vehicles
Figure 1 shows the share of U.S. vehicle exports in 2007 for destination countries with export purchases greater than $200 million. While Canada captured 46.5 percent of this export category in 2007 and Mexico captured 12.5 percent, the relative share for these two countries has been declining recently. Other destination countries have become more important markets. For example, Germany's share increased from 7 percent in 2006 to 7.9 percent in 2007.
Figure 1: Exports of Vehicles and Parts (Excluding Railway), 2007 Destination Countries for U.S. Exports of Greater than $200 Million
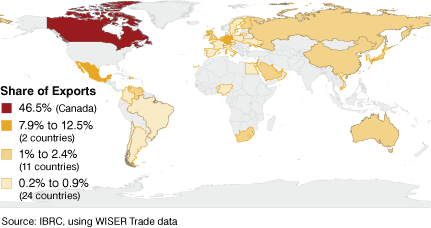
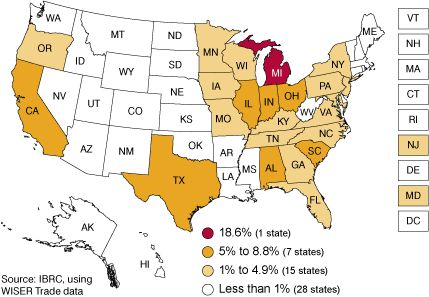
Figure 2 presents the source of these vehicle and parts exports on a state-by-state basis. With an 18.6 percent share of U.S. vehicle and parts exports, Michigan's exports are more than twice as great as the runner-up state of Ohio. Indiana ranks fifth, contributing 6.1 percent of U.S. exports of vehicles and parts. Texas and Illinois rank third and fourth, respectively.
Figure 2: Share of U.S. Vehicle Exports (Excluding Railway), 2007
Whether Indiana can maintain the number five spot into the future is an open question. Figure 3 shows a significant re-alignment of vehicle exports among the states. The top five states have had similar growth rates from 2001 to 2007, but the states ranked sixth through eleventh have had growth rates that are twice those of the Great Lake states (and Texas).
Figure 3: Leading States in the Export of Vehicles and Parts (Excluding Railway), 2001 to 2007
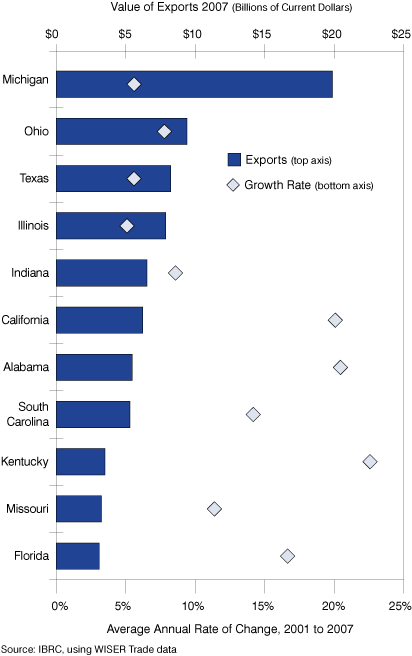
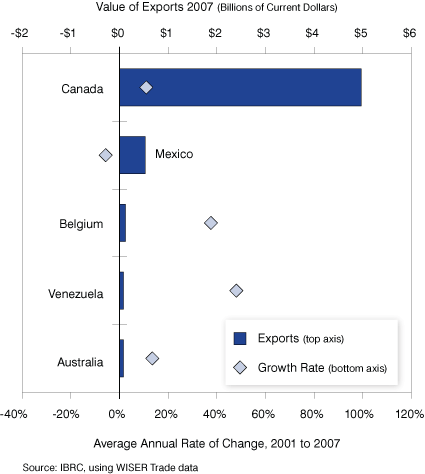
Figure 4 shows how the top five destinations for Indiana's vehicle exports compare. As noted above, Canada has been the largest market and most consistent export market for Indiana's vehicles and parts. While the Mexican market received over $500 million in Indiana vehicle exports in 2007, the market has not been consistent. In 2004, exports to Mexico jumped nearly $250 million, only to tumble by nearly $190 million the following year. Since 2001, Indiana exports of vehicles and parts to Mexico have fallen at an average rate of 5.7 percent a year. The destination countries that are smaller markets have erratic growth rates and volumes. For example, the Netherlands and Austria dropped out of the top five destinations in 2006 to be replaced by Venezuela and Australia in 2007.
Figure 4: Indiana's Top Five Export Destinations for Vehicles and Parts (Excluding Railway), 2007
While vehicles and parts is Indiana's largest export category, the export of industrial machinery grew rapidly in 2007 and the gap between the first and second ranking is closing.
Industrial Machinery
Figure 5 presents export value and growth among the top state exporters of industrial machinery. Indiana remained just out of the top 10 in 2007, despite a 25.9 percent increase over 2006. Figure 6 plots the 2007 value of exports and the 2001–2007 rate of growth for industrial machinery exports to Indiana's top five destinations. In 2007, China overtook Japan to become Indiana's fourth-largest machinery export destination. Exports to China increased at an 18.2 percent annual rate of change from 2001 to 2007. Brazil, another developing-country powerhouse, just missed the top five after nearly doubling its machinery exports from Indiana between 2006 and 2007.
Figure 5: Leading States in the Export of Industrial Machinery, 2001 to 2007
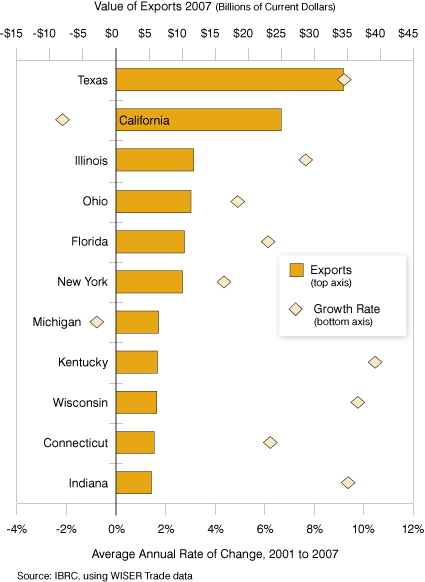
Figure 6: Indiana's Top Five Export Destinations for Industrial Machinery
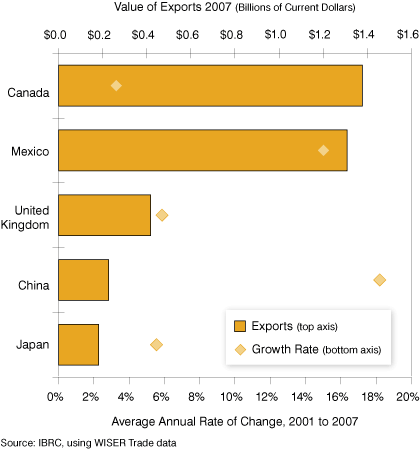
Hidden in this “top five” presentation is that the larger market for Indiana industrial machinery is much more diverse and exports to those other destination countries have surged. Taken together, Indiana exports to Canada, Mexico, the United Kingdom, China and Japan—about 65 percent of the export market—grew by 16 percent from 2006 to 2007. The next five destination countries—representing about 21 percent of machinery exports from Indiana—grew by 30 percent from 2006 to 2007. The remaining destination countries purchased 42 percent more industrial machinery from Indiana in 2007 than they did in 2006.
Pharmaceuticals
Leading pharmaceutical exporting states are shown in Figure 7. California and Massachusetts are the leaders among the states with 16.9 percent and 13.6 percent of pharmaceutical exports, respectively. (While Puerto Rico contributes 32 percent of the nation's pharmaceutical exports, it is not included in the state rankings.) With 9.5 percent of the state share of pharmaceutical exports, Indiana ranks third. In addition to its third place ranking among the states, Indiana has had faster than average growth in exports and its growth rate ranks third among the top pharmaceutical states, just edging out Pennsylvania for the 2001–2007 period (see Figure 8).
Figure 7: Share of U.S. Pharmaceutical Exports, 2007
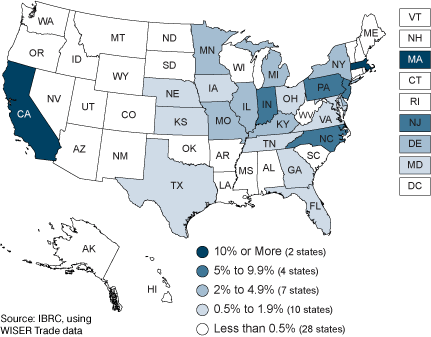
Figure 8: Leading States in the Export of Pharmaceuticals, 2001 to 2007
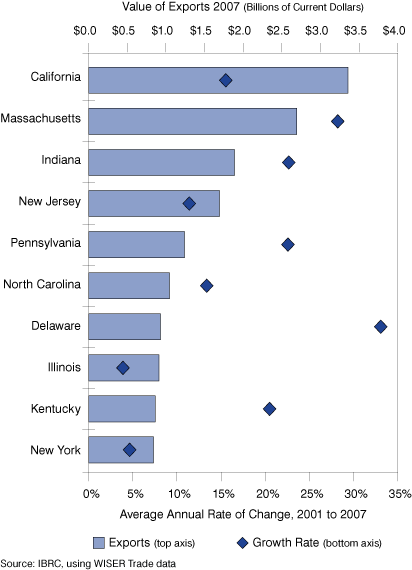
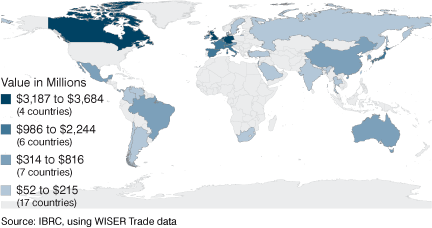
Figure 9 presents the top five export destinations for Indiana's pharmaceuticals. There is, by all appearances, great strength in the European market. Four of the top five export destinations for Indiana's pharmaceuticals are in Europe (see Figure 10 ). There is a note of caution for evaluating the size of the pharmaceutical markets: Demand and sales for these products can be erratic. Spain, for example, imported $189 million worth of pharmaceutical products in 2002 from the United States. By 2004, that total had more than doubled to $467 million. In 2006, U.S. exports of pharmaceuticals to Spain had fallen to $231 million. Then, in 2007, came another dramatic change. The total value of U.S. pharmaceuticals exported to Spain jumped 334 percent to total over $1 billion.
Figure 9: Indiana's Top Five Export Destinations for Pharmaceutical Products
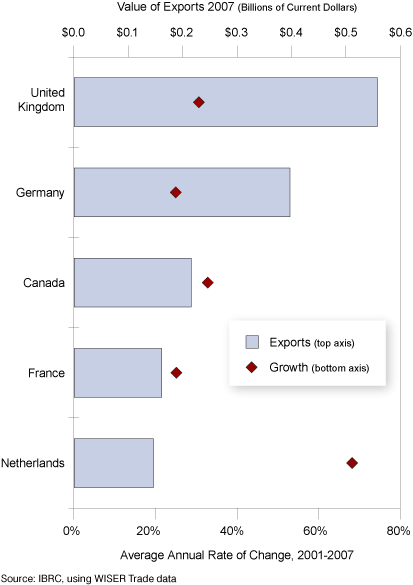
Figure 10: Exports of Pharmaceutical Products, 2007 Destination Countries for U.S. Exports of Greater than $50 Million
Conclusion
Vehicles and machinery remain Indiana's top two export commodities and both have had an expansion in their export sales in recent years. The rapid growth of pharmaceutical product exports—23 percent growth at an average annual rate since 2001—has made it Indiana's fourth largest export commodity and therefore worth watching. To learn more about Indiana's exports overall and to learn about each of the other industry exports shown in Table 1, read the full report online at www.stats.indiana.edu/topic/exports.asp.
Table 1: Indiana's Top 10 Export Industries
| Industriesa | Exportsb |
Percent Changec |
|
2007 |
2006-2007 |
2001-2007 |
|
| Vehicles and Parts (Excluding Railway) | $6,534 | 10.5% | 8.6% |
| Industrial Machinery (Including Computers) | $5,363 | 23.1% | 9.4% |
| Electric Machinery and Electronics | $2,019 | 12.0% | 7.4% |
| Pharmaceutical Products | $1,887 | 11.2% | 22.7% |
| Organic Chemicals | $1,655 | 10.9% | 10.0% |
| Optical and Medical Instruments | $1,556 | 5.8% | 9.5% |
| Iron, Steel and Articles Thereof | $1,172 | 25.0% | 17.8% |
| Plastics and Articles Thereof | $936 | -7.2% | 7.0% |
| Miscellaneous Chemical Products | $657 | -3.8% | 7.4% |
| Aluminum and Articles Thereof | $433 | 16.2% | 7.9% |
b. Value of exports in millions
c. Average annual growth rate
Note
- All data are from WISER Trade.
—Timothy Slaper, Director of Economic Analysis
Indiana Business Research Center, Kelley School of Business, Indiana University
