Indiana Population Projections by Race and Hispanic Origin
Indiana's population will become increasingly diverse over the next 20 years as the state's Hispanic, “two or more races,” Asian and black populations grow rapidly. Indiana's white and American Indian populations will grow as well, although at a more modest pace. In fact, while the state's white population will increase by 8 percent between 2005 and 2030, its share of total population will decline.
The two-or-more races category will be Indiana's fastest growing group, increasing 135 percent between 2005 and 2030 (see Table 1). In terms of numeric growth, Indiana's black population will exhibit the greatest increase among non-white race groups with a gain of 146,000 people. The state's Asian1 population will grow rapidly as well, with a 54 percent rate of growth. The American Indian and Alaska Native group—Indiana's smallest race category—will add 2,700 people, equating to a 14 percent increase.
Table 1: Indiana's Projected Population Change by Race and Hispanic Origin, 2005 to 2030
Population Estimate, 2005 |
Share of Total Population, 2005 |
Population Projection, 2030 |
Share of Total Population, 2030 |
Percent Change, 2005-2030 |
|
| White | 5,548,064 | 88.5% | 6,010,300 | 85.6% | 8% |
| Black | 555,465 | 8.9% | 701,500 | 10.0% | 26% |
| Asian | 81,802 | 1.3% | 125,900 | 1.8% | 54% |
| Two or More Races | 68,084 | 1.1% | 159,800 | 2.3% | 135% |
| American Indian | 18,561 | 0.3% | 21,200 | 0.3% | 14% |
| Total | 6,271,976 | 100% | 7,018,700 | 100% | 12% |
| Non-Hispanic | 5,987,066 | 95.5% | 6,449,200 | 91.9% | 8% |
| Hispanic or Latino | 284,910 | 4.5% | 569,500 | 8.1% | 100% |
We can expect Indiana's population with Hispanic or Latino roots to double over the next 25 years—an increase of roughly 285,000 residents. It is important to note that Hispanic figures refer to an ethnic group rather than a race and, therefore, its population can be of any race. A sum of the five race categories will provide the state's total population but the Hispanic numbers must be considered separately.
These are a few of the highlights from the recent Indiana population projections by race and Hispanic origin released by the Indiana Business Research Center. In addition to the projections by age, sex, race and Hispanic origin for the state, total population projections are available for each county that has a minimum of 2,000 residents in any race or ethnic category. The projections cover 2010 to 2040. However, since population projections are subject to error and these inaccuracies become more likely as the projection horizon increases, this article focuses on projections to 2030.
White Population Growth Slow yet Steady
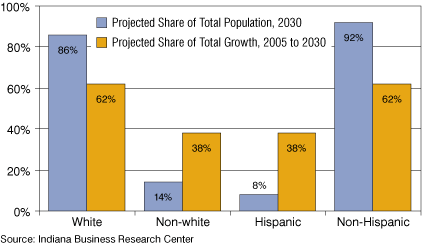
Indiana's white population will top 6 million for the first time by 2030—an 8 percent growth over its 2005 estimate of 5,548,000. This nearly half-million population increase, however, will account for only 62 percent of the state's total growth over that period (Figure 1). Therefore, the share of Indiana's residents that are white is expected to decline from 88.5 to 85.6 percent by 2030.
Figure 1: Comparison of Projected Share of Population in 2030 to Projected Share of Growth from 2005 to 2030

Much like overall population growth in Indiana, the white population will grow most quickly in suburban counties around Indianapolis with Hamilton, Hendricks, Johnson, Boone and Hancock counties registering the fastest growth over this period. The quickest growing white populations outside of the Indianapolis metro area include Elkhart and LaGrange counties.
Black Population Up to 700,000 by 2030
Indiana's black population, already the state's largest non-white group, is expected to expand by more than one-quarter by 2030. This increase will bring the population from 555,500 in 2005 to slightly more than 701,500. These additional 146,000 residents will take the black share of total population from 9 percent to 10 percent. Furthermore, 20 percent of Indiana's total growth over this period is anticipated to occur in the black population.
Porter County is projected to have the state's fastest growing black population at 212 percent growth to bring the total from 3,315 to 10,300. Also at triple-digit growth will be Hamilton County at 181 percent. Counties with the largest numeric gains include Marion (63,200), Lake (13,900), Hamilton (13,700) and Allen (10,900).
Asian Population Continues to Climb
Among race groups, the Asian population will be second only to the two-or-more-races category in terms of growth rate with an increase of 54 percent between 2005 and 2030. This rate will bring the Asian population total to 125,900. Over this same period, the Asian population is expected to account for 6 percent of Indiana's total growth and its share of total population will shift from 1.3 percent to 1.8 percent.
Hamilton County has seen the strongest growth in its Asian population in recent years (this group nearly doubled between 2000 and 2005). This trend is expected to continue as the county is projected to add 11,100 Asian residents by 2030 for a total of 20,100—a 124 percent increase. This growth would move Hamilton County past Marion County to give it the state's largest Asian population. Allen County is projected to have the second highest growth rate (78 percent) which will bring its population to 11,700. Others in the top five for projected Asian population by 2030 are Marion (17,500), Tippecanoe (12,000), and Monroe (8,600) counties.
American Indian Population Small but Growing
The state's American Indian population is predicted to expand from 18,561 to 21,200. Even with this 14 percent growth, the American Indian share of total population will remain essentially unchanged at 0.3 percent. Despite the overall growth trend, the American Indian population is the only race or ethnic group among those discussed here that are expected to lose population within this projection period. After peaking at 21,500 in 2025, this population is projected to begin a period of slight population loss with a 1 percent decline between 2025 and 2030. American Indian fertility rates in recent years have been well below the state average and are a leading factor behind this trend.
Marion County is home to the state's largest American Indian population with 2,652 residents in 2005 (14 percent of the total). Marion County is forecast to add an additional 600 to this population, which translates into a 23 percent increase. The remainder of the state will grow by 13 percent.
Multiple Race Population Will Expand Rapidly
The state's population with more than one race is likely to soar in the coming decades. This population is expected to grow from its 2005 size of 68,084 to 159,800 by 2030—a 135 percent increase —the largest rate of any race or ethnic group. This increase will account for 12 percent of the state's total growth.
The primary reason for this growth is the extreme youth of this population. According to the 2005 Census population estimates, 55 percent of Indiana's multiple race population was below the age of 20 compared to 28 percent for the state on whole. Furthermore, state records from 2000 to 2005 indicate that the number of births to parents of two different races has increased each year.
Hispanic Population Expected to Double by 2030
The Hispanic population is projected to add 284,600 residents by 2030. This figure equates to a 100 percent increase over 2005 and will account for 38 percent of the state's total growth. As a share of Indiana's total, the Hispanic population is expected to jump from 4.5 percent to 8 percent in 2030. This rapid growth projection is based on recent trends in Indiana of both high rates of in-migration and fertility rates that are well above other sub-populations covered in these projections.
Nearly all counties will see relatively substantial increases in their Hispanic populations. Counties expected to have the largest numeric increases are Marion (87,800), Elkhart (33,500), and Lake (23,300). Among counties that had at least 2,000 Hispanic or Latino residents in 2005, those expected to grow most rapidly are Hamilton (202 percent), Bartholomew (183 percent), Marion (171 percent) and Hendricks (163 percent).
Age Distribution
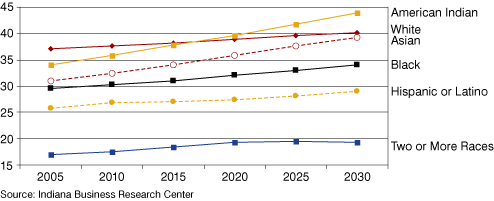
Aging is one of the dominant demographic trends in Indiana and nationally. Each of the race and ethnic groups considered here will get older in the coming decades. However, there is a great diversity in their age distributions as illustrated by the comparison of median ages in Figure 2. The two or more races population is very young with a median age of 17 in 2005. This mark will climb only slightly to 19 by 2030. The black and Hispanic populations are also quite young with marks below 30 in the base year. Both will remain among the youngest sub-populations in the next 25 years. Aging will be most pronounced in the American Indian, white, and Asian populations as the first two will have median ages above 40 by 2030 and the Asian population will likely approach that mark.
Figure 2: Projected Median Age by Race and Hispanic Origin, 2005 to 2030

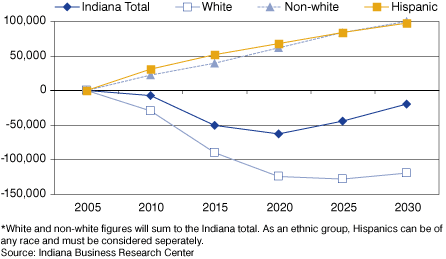
From an economic development perspective, the 25-to-54 age group is a key demographic that covers the prime working years. Figure 3 indicates that if recent trends persist, the state can expect to lose population in this age group because of the aging baby boom generation (who were between the ages of 41 and 59 in 2005).The loss is projected to trough in 2020 when the population in this age group will be 62,400 people below its 2005 level. The 25-to-54 age group will recover somewhat after 2020 to reach a level that is 19,000 people below the base year. Losses in the white population will primarily drive this decline, but persistent growth among minority populations will blunt its effects up to 2020 and spur the subsequent rebound.
Figure 3: Projected Cumulative Population Change for those Age 25 to 54, 2005 to 2030*

Indiana in Perspective
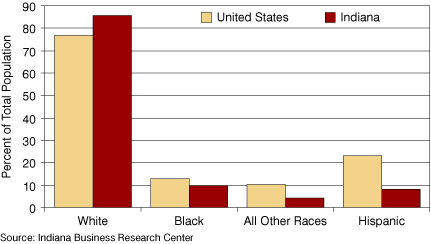
While it is true that Indiana's racial and ethnic composition will shift, the state is—and will remain—much less diverse than the nation. A comparison of the Indiana projections to national projections2 produced by the U.S. Census Bureau reveals that Indiana's share of total population that is white is projected to be a full 9 percentage points higher than the nation (see Figure 4). Each of the other race and ethnic groups will hold a higher proportion nationally—most notably the Hispanic population, which is expected to make up 23 percent of the U.S. population in 2030 compared to 8 percent in Indiana.
Figure 4: Projected Share of Total Population in the United States and Indiana, 2030

For more on the Indiana population projections by race and Hispanic origin, please visit www.stats.indiana.edu/topic/projections.asp.
Notes
Matt Kinghorn, Demographer
Indiana Business Research Center, Kelley School of Business, Indiana University
