Increasing Unincorporation
The movement of Hoosiers away from large central cities to suburban cities is hardly a new phenomenon and has been written about numerous times within the pages of this publication. But just how many people forego cities and towns altogether to live in unincorporated areas of the state?
Most Hoosiers (64 percent) still live somewhere within the city or town limits of Indiana's 567 incorporated places, according to the Census Bureau's population estimates for 2006. The remaining 36 percent, almost 2.3 million people, live outside those boundaries. Those shares have been stable since 2000 because of annexations; otherwise, there would have been a slight 1 percentage point shift in population to unincorporated areas.
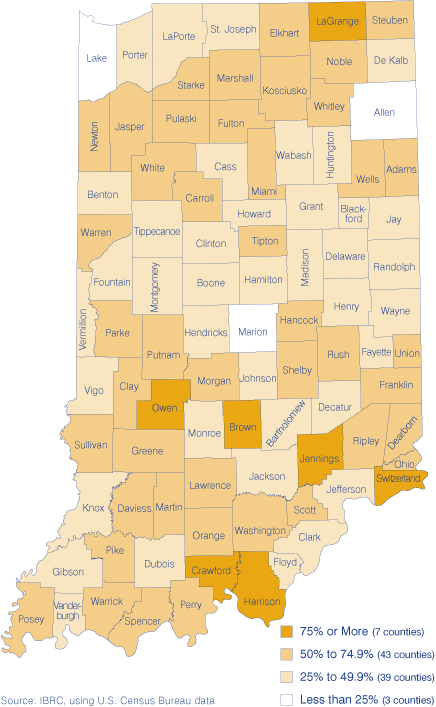
Fifty of the state's 92 counties have more than half of their population living in unincorporated areas, as seen in Figure 1. Levels of incorporation run the gamut, from Brown County (where only 5 percent of the population lives within an incorporated place) to Marion County (where the entire county is incorporated).
Figure 1: Percent of Population Living in an Unincorporated Area, 2006

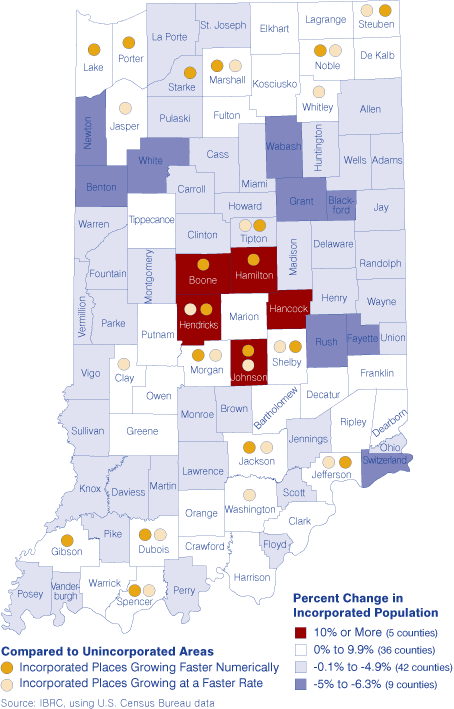
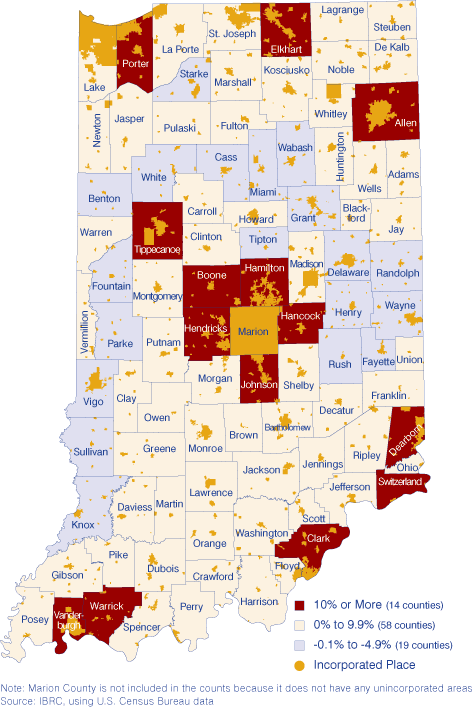
What is more interesting is to look at the numeric and percent change in incorporated and unincorporated areas between 2000 and 2006. We will use the 2000 population base, which takes annexation into account, in order to compare apples to apples.1 Statewide, both incorporated areas and unincorporated areas grew during this time period. Unincorporated areas added nearly 148,000 residents (for a growth rate of 7 percent), while incorporated places added roughly 85,000 people (for a growth rate of 2.1 percent).
Only 41 counties saw their incorporated places increase in population between 2000 and 2006 (see Figure 2). Meanwhile, 72 counties saw an increase in the population living outside city and town boundaries (see Figure 3).
Figure 2: Percent Change in Population Living in Incorporated Places, 2000 to 2006

Figure 3: Percent Change in Population Living in Unincorporated Areas, 2000 to 2006

So why are more and more people finding unincorporated areas attractive places to live? For many, it is not necessarily a conscious choice. If someone chooses to live in an unincorporated area, it is not as if they are choosing "life in the middle of nowhere" over "life in the city" (in most cases anyway). The line where an incorporated place begins and ends is increasingly blurry as more people and businesses move out to the edges. Many consider suburbanization such as this "a natural consequence of economic growth, rising real incomes, and cheaper and better transportation over time."2 In the long run, however, this "movement to the outskirts" could have serious implications on everything from the environment to the mechanisms used to fund services provided by cities and towns—making it a trend worth keeping tabs on.
Notes
- The population base adjusts the 2000 population to take into account any boundary changes that have occurred since then. Thus, the population base is the 2000 population of an area as defined by the current (2006) city or town boundaries.
- Akram Temimi and Manfred Dix, "Federal Grants and the Flight to the Suburbs," Quarterly Review of Economics and Finance 41, No. 4 (2001): 533-543.
Rachel Justis, Geodemographic Analyst
Indiana Business Research Center, Kelley School of Business, Indiana University
