Major Livestock and Poultry Operations Across Indiana: A Census of CFOs and CAFOs
Communities in Indiana are increasingly considering the expansion of large animal farms as key sources for food manufacturers1 and as part of broader strategies for economic development. This article describes the location, size and type of animal feeding operations that require permits from the Indiana Department of Environmental Management (IDEM). While there are many small farms that do not require such regulation, large permitted farms are particularly important because they account for the vast majority of meat, dairy, poultry and egg production in the state.
CFOs and CAFOs
IDEM designates farms as confined feeding operations (CFOs) when they maintain large numbers of animals in spaces covered with less than 50 percent vegetation for 45 days or more during the year. The number of animals is based on the size and feeding habits of particular species since this determines the land size and sewerage system needed to safely dispose of their manure. Generally, large farms with at least 300 dairy cows, 600 swine or sheep, or 30,000 poultry are designated CFOs.2
The term “CAFO,” for concentrated animal feeding operation, is often mistakenly used to describe all major farms, but these are actually a subset of CFOs with substantially larger numbers of animals (such as 700 dairy cows, 2,500 swine or 125,000 poultry) so that they require additional federal regulation.3
Animal Units
The relative sizes of all animal farms can be compared regardless of their different types by calculating their equivalent animal units. While regulatory organizations often calculate animal units based on the environmental impact of particular species, a more intuitive way is to compare animals based on their average live weights.4 Table 1 summarizes the animal units for 17 farm animals by designating the value of “1.000” to represent 1,000 pounds of live weight. Based on this system, a farm with 350 mature dairy cattle would be the equivalent “size” as a farm with 3,000 finishing pigs and 2,000 nursery pigs.
Table 1: Equivalent Animal Units Based on Live Weights, 2002
| Animal Type | Animal Name | Average Live Weight (Pounds) | Animal Unit (One animal unit is 1,000 pounds live weight) |
| Pigs | Nursery Pigs | 20.0 | 0.020 |
| Finishers | 150.0 | 0.150 | |
| Sows | 425.0 | 0.425 | |
| Boars | 425.0 | 0.425 | |
| Beef | Beef Calves | 450.0 | 0.450 |
| Beef Cattle | 1,200.0 | 1.200 | |
| Dairy | Dairy Calves | 150.0 | 0.150 |
| Dairy Heifers | 750.0 | 0.750 | |
| Dairy Cattle | 1,400.0 | 1.400 | |
| Veal Calves | 250.0 | 0.250 | |
| Chickens | Pullets | 1.5 | 0.002 |
| Broilers | 3.0 | 0.003 | |
| Layers | 3.5 | 0.004 | |
| Other | Turkeys | 15.0 | 0.015 |
| Ducks | 3.5 | 0.004 | |
| Sheep | 100.0 | 0.100 | |
| Horses | 1,000.0 | 1.000 | |
Source: U.S. Department of Agriculture data provided by the Indiana Department of Environmental Management (IDEM), courtesy Michael Dunn (environmental manager)
Diversity of Major Animal Operations
The number, type and location of CFOs are widely discussed topics in rural Indiana.5 While some operators find that these large farms are more efficient than small farms in reducing costs and increasing production, residents often complain about threats to their quality of life. However, due to the tremendous diversity of CFOs, the concerns of farm operators, residents and local legislators vary substantially from county to county.
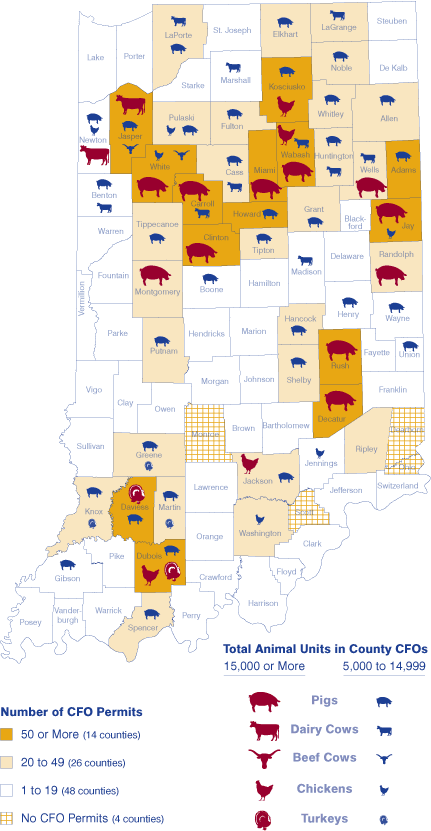
The shaded colors in Figure 1 display the number of active CFO permits by county. While most counties have at least one CFO, only a small portion have 50 or more of these large farms, notably Carroll, Daviess, Decatur, Dubois, Jay and Wabash counties (all have over 80 each). On the other end of the spectrum are Dearborn, Monroe, Ohio and Scott—counties with no farms large enough to require permits.6
Figure 1 also shows symbols for the major animals—pigs, dairy cattle, beef cattle, chickens and turkeys—approved for over 5,000 animal units in the CFOs of each county.7 While there are many large feeding operations with permits for ducks and other animals, no county has a combined total greater than 5,000 animal units for these animals on their CFOs. It is therefore possible that a greater proportion of these animals are raised on smaller farms that are beyond the scope of this article.
Figure 1: Number of CFOs by County and Main CFO Animals, Active Permits through 2007
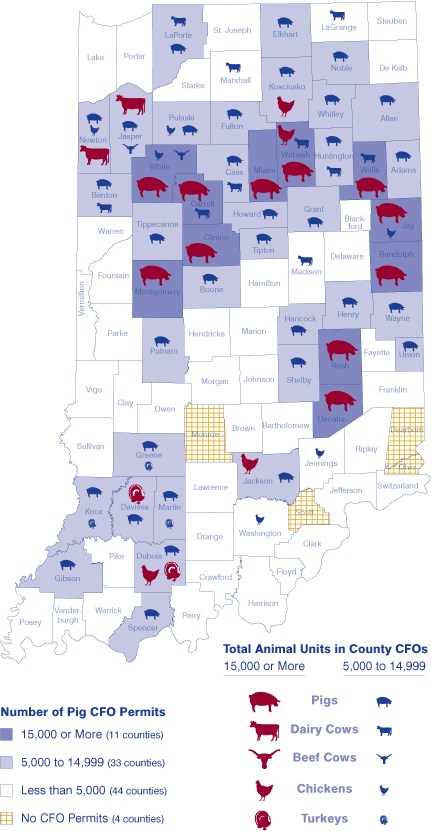
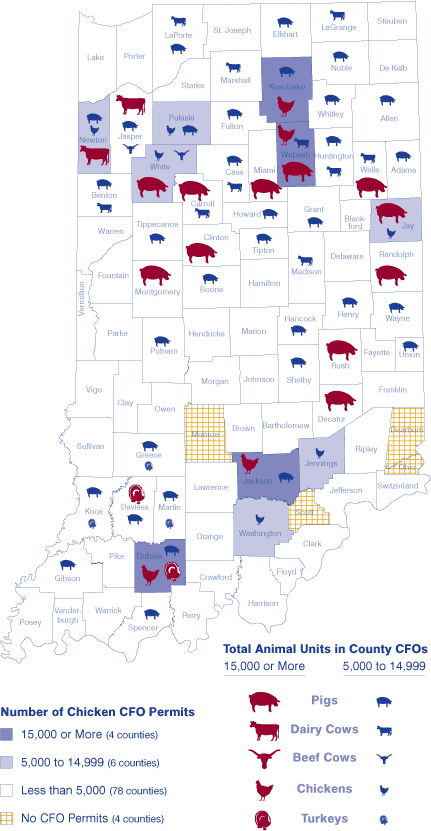
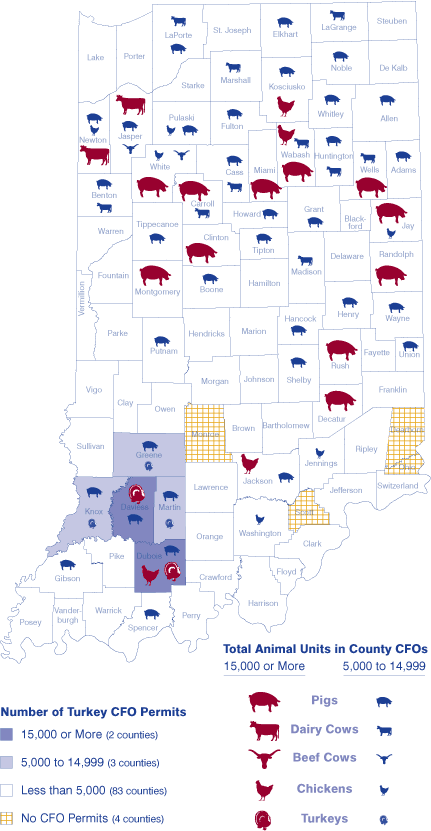
Since pork is the major livestock industry in Indiana, it is no surprise that 44 of Indiana's 92 counties have approvals for at least 5,000 animal units of pigs on their CFOs. Leading the way here are the Carroll County CFOs with combined permits for 45,000 animal units. Ten other counties' hog CFOs had permits for more than 15,000 animal units. Looking regionally, there are major pig farms throughout Indiana, though there are notably fewer in the southeastern part of the state (Economic Growth Region 10).
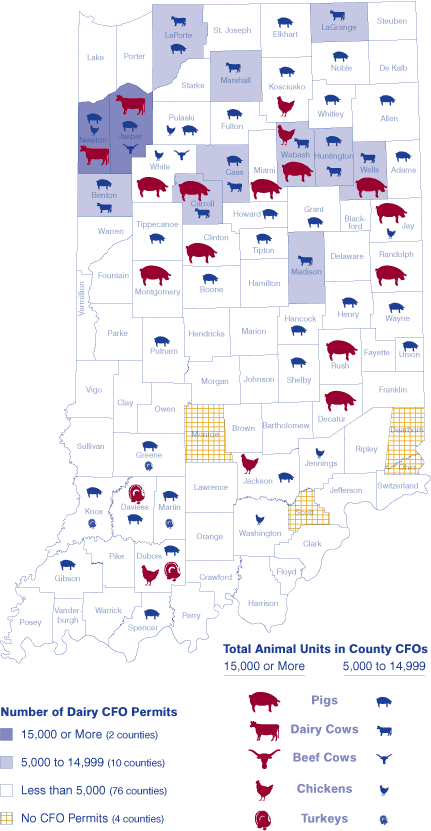
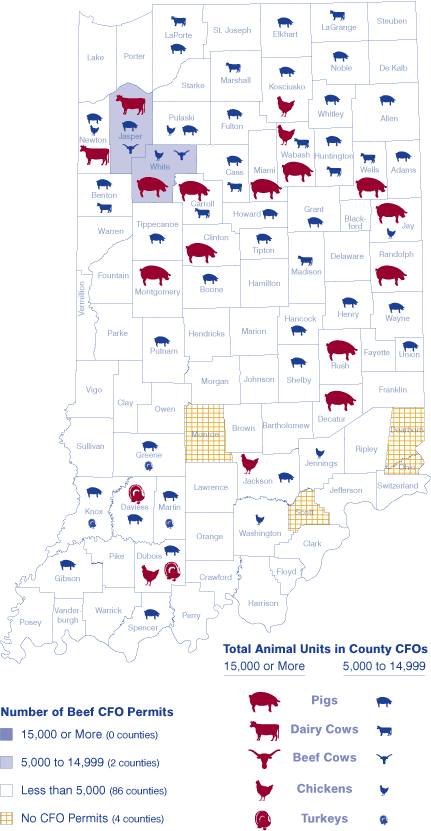
Other major livestock industries are dairy and beef. Jasper and Newton County CFOs have by far the most dairy cow permits with more than 30,000 animal units each. Only 10 other counties have dairy permits for 5,000 animal units or higher and all were in northern Indiana, particularly Economic Growth Region (EGR) 1 in the northwest. While there are substantially fewer beef permits, CFOs in Jasper and White counties (again in the northwest) have more than 5,000 animal units of beef cattle.
Among Indiana's poultry operations, the counties with the largest number of chicken CFO permits are Dubois, Jackson, Kosciusko and Wabash—among 10 counties with chicken permits for at least 5,000 animal units. Only five counties' CFOs have turkey permits for 5,000 animal units or higher, the largest of which is easily Dubois county with more than 28,000 animal units (roughly 1.9 million turkeys). Large poultry operations can be found throughout the state but they are most prevalent in southern Indiana where poultry permits on CFOs often equal or outnumber pig permits.
From Small Mixed Farms to Large Hog CFOs
While Indiana leads the nation in duck production and has large chicken inventories, the trend in CFO permits is clearly away from small diverse farms toward the creation of large pig operations. The influential 2004 BioCrossroads study suggested that the pork industry should be a key part of Indiana's agricultural development strategy due to its relatively high wages, strong prospects for growth and historic prominence in the state.8 Stemming from these findings, the Indiana Department of Agriculture's strategic plan for 2025 includes a vision to reverse the trend of decreasing pork inventories to double overall pork production.9
While the size of permits fluctuates annually based on the economy's effect on the agriculture industry, CFOs are clearly getting much larger today than they have ever been. Figure 2 shows that new CFOs were approved for a record 163,590 animal units in 2007. That is more than twice the annual total of CFOs approved 10 years ago even though the number of permits is roughly the same in each year (134 to 139, respectively). Even the size of an individual farm today can exceed 10,000 animal units, whereas the combined size of all CFOs approved in a single year never passed the 10,000-animal-unit mark prior to 1991.
Figure 2: Total Number of Animal Units for Indiana CFOs and CAFOs by Animal Type, 1990 to 2007
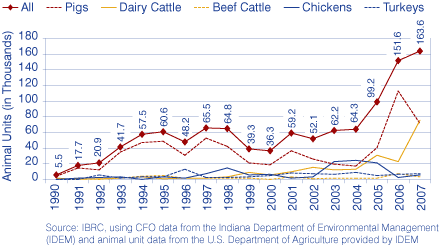
Mirroring the state's agricultural initiatives, we also see in Figure 2 that there have been more new CFO permits for pigs than for any other animal since 1990, with a high of 112,298 animal units in 2006. In that year, the most popular region for new pig permits was EGR 6 (including eastern counties such as Jay and Randolph) where pig permits accounted for more than one-third of pig CFO permits statewide. Looking at other animals, new chicken permits briefly spiked between 2003 and 2005 but dropped markedly in 2006. Dairy cattle permits have risen steadily and surpassed pig permits for the first time last year. While all other animal permits have been relatively low across the 1990 to 2007 time period, it should be noted that beef cattle permits moved up to 7,611 animal units in 2006 approaching its historic high of 7,754 animal units in 1975.
We can expect the trend toward CFO creation, particularly CAFOs, to remain a major topic among Indiana farmers, economic developers and residents. Interested parties should continue to learn more about the impacts of these farms and stay tuned for innovative studies by government agencies and interest groups that will be released in the coming months.
Notes
- To learn more about Indiana's food manufacturers, see Molly Manns, “Indiana's Edible Industry: Food Manufacturing,” InContext, February 2008: 8-10.
- For detailed information on the environmental regulation of Indiana farms, visit the IDEM Confined Feeding Operations website at http://www.in.gov/idem/4994.htm.
- Federal guidelines for animal feeding operations are available at this U.S. Environmental Protection Agency website: http://cfpub.epa.gov/npdes/home.cfm?program_id=7.
- This information comes from a conversation with Mike Dunn (environmental manager at IDEM).
- For news articles about CFOs, CAFOs and other agricultural concerns throughout Indiana, please visit the Indiana Economic Digest agriculture topic index at www.indianaeconomicdigest.net/main.asp?SectionID=31&SubSectionID=68.
- According to Mr. Dunn, IDEM sometimes requires small farms to register and fulfill the same requirements of CFOs for several years. This may be due to environmental concerns specific to a particular operation.
- The data for this analysis come from the IDEM CFO database of all currently permitted farms from 1970 through 2007.
- This BioCrossroads report is available online at
www.biocrossroads.com/news. - Details on the Indiana Department of Agriculture's Strategic Plan can be found at
www.in.gov/isda/2539.htm.
Michael F. Thompson, Economic Research Analyst
Indiana Business Research Center, Kelley School of Business, Indiana University
