Monthly Metrics: Indiana's Workforce Dashboard
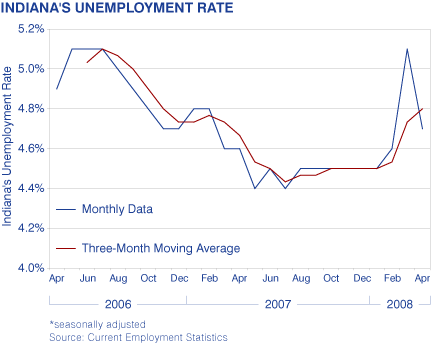
Why the Spike in March Unemployment?
Significantly wetter than normal weather meant fewer construction jobs in 2008 than usual opening up and more unemployment claims filed than normally would be expected this time of year, even taking into account the seasonally adjusted figures we are using. Other important factors to note when viewing the unemployment rates so far this year include the American Axle strike, which also affects the April and will perhaps even affect May numbers as well. The layoffs at Pfizer may also have contributed to this out-of-the-ordinary spike in the unemployment numbers for March. Look for the floods in June to affect those rates as will the “unseasonably” wetter weather.
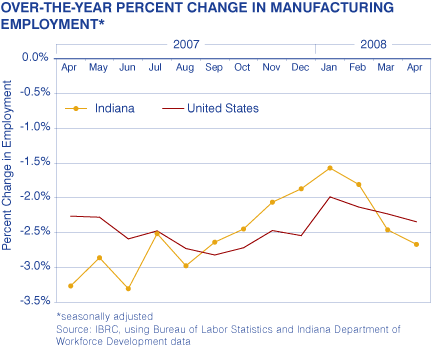
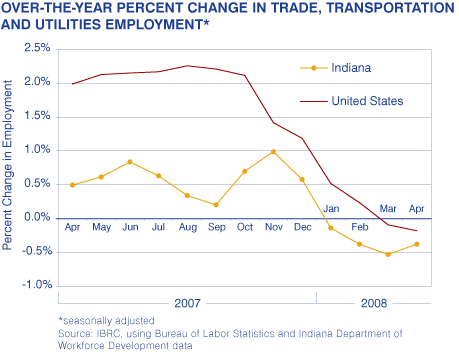
Change in Employment by Industry Super-Sector, 2006 to 2007*
| Industry |
Indiana |
United States |
|
|
Change in Jobs |
Percent Change |
Percent Change |
|
| Total Nonfarm | 2,800 | 0.1 | 0.3 |
| Educational and Health Services | 12,500 | 3.2 | 3.0 |
| Natural Resources and Mining | 200 | 2.9 | 4.0 |
| Information | 900 | 2.3 | -0.8 |
| Government | 9,000 | 2.1 | 1.0 |
| Other Services | 600 | 0.5 | 0.7 |
| Professional and Business Services | 1,500 | 0.5 | 0.9 |
| Leisure and Hospitality | -300 | -0.1 | 2.4 |
| Trade, Transportation and Utilities | -2,200 | -0.4 | -0.2 |
| Financial Activities | -600 | -0.4 | -1.0 |
| Manufacturing | -14,700 | -2.7 | -2.3 |
| Construction | -4,100 | -2.7 | -5.0 |
Source: IBRC, using Bureau of Labor Statistics data
