Offshoring and Near-Shoring: Movement of Work Studies
The national debate on offshoring continues as economists dispute the impact of the movement of jobs overseas. With each plant closing or bankruptcy discussed on the evening news, many Americans wonder if these job losses are a result of increasing global competition. What has been the impact on the Hoosier economy? Which industries have been hardest hit by offshoring events? How many workers have been affected? To answer these questions, Indiana's Department of Workforce Development needs solid information on job layoffs from employers. The agency tracks unemployment insurance statistics and mass layoff events for all industries. This will be the first in a series of articles on mass layoff statistics, job losses and the movement of work outside of Indiana.
While mass layoffs are always troubling, they impact less than 1 percent of the Hoosier workforce. With the right education and training programs, we can hope for newer, better jobs on the horizon for laid-off workers.
Mass Layoff Statistics
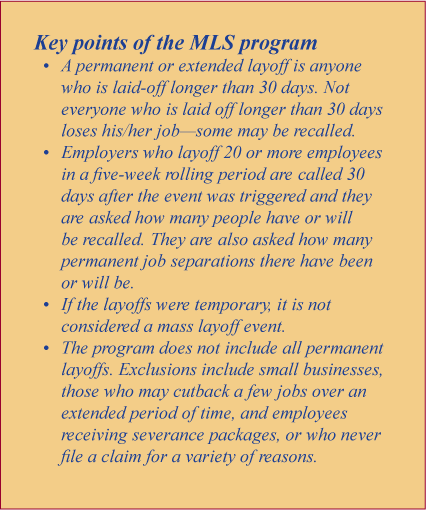
The Mass Layoff Statistics (MLS) Program identifies, describes and tracks the effects of major job cutbacks by monitoring initial unemployment insurance claims filed by employees. By identifying and analyzing the permanent mass layoffs in Indiana, the program seeks to help find employment and training solutions to problems created by major permanent job cutbacks. Economic developers can also use this data to determine the available labor supply for new employment opportunities.

Total Layoffs
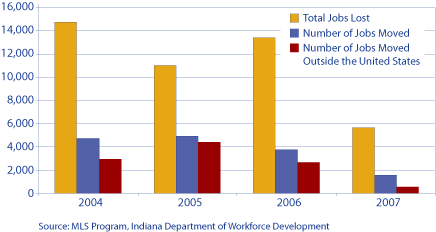
Since 2004, Indiana has lost 44,808 jobs within 322 permanent (extended) mass layoff events. (1) The number of layoff events varies from year to year. In 2004, 91 events resulted in 14,728 separations. In 2005, 70 events led to 11,033 separations. This was followed by 99 events totaling 13,396 separations in 2006. Although there have been 62 events in the first and second quarter of 2007, the current year has seen slightly lower numbers of separations over last year—only 5,651 jobs lost thus far.
So what is the context? Indiana total nonfarm employment in 2004 was 2,928,900 and 2,973,400 in 2006. (2) Only about 0.4 percent of the Hoosier nonfarm workforce filed for unemployment during these permanent mass layoff events. Although the number of impacted workers is undoubtedly larger, as workers may be let go over time and small businesses layoffs are not included, it is important to note the context. While these layoffs impact many workers and often create newsworthy events, the true picture of Indiana employment is more stable—and the unemployment rate has averaged 4.8 thus far in 2007.
Job Losses by Industry
Over this three-and-a-half year period, 67 percent of the jobs lost due to layoffs were in the manufacturing industry, and half of these mass layoff manufacturing jobs were lost in the transportation equipment industry. The retail trade industry permanently laid off 5,245 workers, which accounts for 12 percent of total separations since 2004. Employers in the finance sector provided 4 percent of the jobs lost, while 3 percent were in transportation and warehousing, and 2 percent were in health care. The food service industry lost just fewer than 400 jobs (mostly in 2004), while accommodation and other services let go a combined 320 workers since 2004 via mass layoffs.

Offshoring Trends
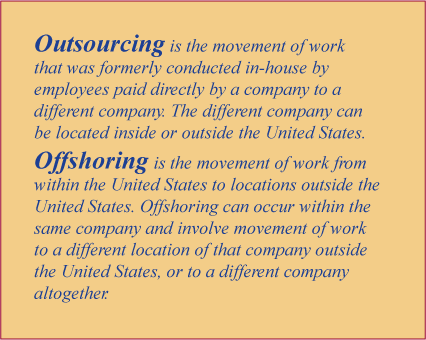
Since the 1980s, Midwestern manufacturing has experienced layoffs due to movement of work overseas. The widespread effects of offshoring (substituting foreign for domestic labor) is not news to Hoosiers. After the dot-com boom and bust, the offshoring issue became an important part of the national dialogue. While workers in manufacturing industries have long been exposed to foreign competition and technology advances, the rise of the information economy has widened the impact of globalization and created vulnerabilities among a variety of industries.
Although offshoring and plant closing activity has been going on for years, and may have even peaked in 2001, MLS did not begin capturing specific data on movement of work until January 2004. As a result, MLS is just starting to build its historical database, and we will be looking at a snapshot in time covering the last three years. Of the 44,808 total jobs lost since 2004, just over one-third of these were moved, and only 24 percent were moved offshore (see Figure 1). There is variability from year to year in both volume of jobs lost and in where the jobs move. Many of the jobs move out of Indiana, yet remain in the United States. Of the 14,728 jobs lost in 2004, 32 percent moved, and only 20 percent were moved offshore. 2005 took the biggest loss from offshoring as 89 percent of the jobs that were moved relocated overseas. In 2006, that figure dropped to 70 percent of jobs moved. So far in 2007, just over one third of jobs moved left the country. The vast majority of the jobs leaving the country go to Mexico (see Table 1). The next largest percentage of jobs move to Canada, with few jobs leaving for India, China or other countries far overseas. This “local” movement of jobs is known as near-shoring. (3) Historically, jobs that leave the United States opt for a cheaper yet relatively close geographic locale. This has also been the case for those jobs leaving Indiana yet staying within the United States; many of these jobs stay in the Midwest.
Figure 1: Indiana Jobs Lost and Jobs Moved, 2004 to 2007

Table 1: Where Do Jobs Leaving the Country Go?
| Location | Number of Events |
| Mexico | 28 |
| Canada | 6 |
| Unknown | 5 |
| China | 2 |
| England | 1 |
| Brazil | 1 |
| India | 1 |
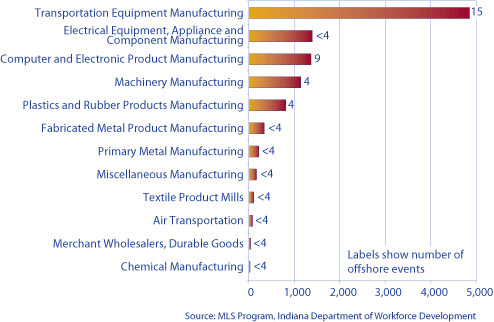
The MLS data collected by Indiana mirrors our expectations of the impact of offshoring in the Midwest. Except for one event in wholesale trade and one event in air transportation, all offshore events over the past three years have been in the manufacturing industry (see Figure 2). Fifteen events and 4,855 jobs were moved offshore in transportation equipment manufacturing alone; but even though this sector was the hardest hit, those jobs accounted for approximately 1 percent of employment in that industry.
Figure 2: Jobs Moved Out of Country by Three-Digit NAICS, 2004 to 2007

Reasons for Layoffs
The MLS program tracks the reasons for layoffs cited by employers to help explain developments or trends in the economy. The reasons are broken down into six categories:
- Business Demand: Reasons include contract cancellation or completion, domestic or foreign competition, slack work, and insufficient demand or business slowdown.
- Disaster/Safety: Reasons include natural disasters (weather and not weather related) and hazardous work environment.
- Financial: Reasons include bankruptcy, cost control measures and financial difficulty.
- Organizational: Reasons include a business ownership change, reorganization and restructuring.
- Production: Reasons include technology advances, labor disputes, material shortages, discontinued product lines, government intervention, etc.
- Seasonal or Vacation
Information on worksite status is also collected, along with whether or not an employer anticipates any worker recalls. During the phone interview, states ask if any jobs are going to be moved or contracted out; if there is a movement of work, the employer is asked where anticipated relocation will occur. As illustrated in Table 2, the most commonly cited reason for a mass layoff is company reorganization. Fourteen of 44 offshore events cite import/foreign competition as a reason, and a few other offshore events are explained by business ownership change, slack work or completed contracts.
Table 2: Reasons for Permanent Mass Layoffs, 2004 to 2007
| Reason for Layoff | Events | Separations | ||
| Total | Moved Offshore | Total | Moved Offshore | |
| Total | 322 | 44 | 44,808 | 10,594 |
| Automation | ||||
| Bankruptcy | 22 | 3,947 | ||
| Business Ownership Change | 28 | 1 | 5,400 | 440 |
| Contract Cancellation | 11 | 1,196 | ||
| Contract Completion | 46 | 1 | 2,357 | 25 |
| Energy Related | ||||
| Environment Related | ||||
| Financial Difficulty | 34 | 4,622 | ||
| Import Competition | 22 | 11 | 3,488 | 2,208 |
| Labor Dispute | 2 | 120 | ||
| Material Shortage | 2 | 110 | ||
| Model Changeover | ||||
| Natural Disaster | ||||
| Non-Natural Disaster | ||||
| Plant or Machine Repair | 1 | 26 | ||
| Product Line Discontinued | 8 | 1,704 | ||
| Reorganization within Company | 103 | 27 | 18,450 | 7,663 |
| Seasonal Work | ||||
| Slack Work | 23 | 1 | 1,094 | 40 |
| Vacation Period | ||||
| Weather Related | ||||
| Other | 3 | 229 | ||
| Not Reported | 1 | 406 | ||
| New Reason Codes in 2007 | ||||
| Cost Control | 1 | 69 | ||
| Domestic Competition | 2 | 159 | ||
| Excess Inventory | 2 | 107 | ||
| Government Regulations | 2 | 93 | ||
| Import/Foreign Competition | 9 | 3 | 1,231 | 218 |
Other Reasons for Job Losses
Productivity increases (the value of goods and services produced in a period of time, divided by the hours of labor used to produce them) may also impact job growth. Recent national research indicates that in many cases, more jobs have been impacted by increases in productivity than movement of work. National data examining GDP shows that productivity in the nonfarm business sector rose 2.6 percent per year from 1995 to 2000. Over the next three years, it rose 4.1 percent. If productivity had been increasing at its previous rate on par with the historical trend, employment in the nonfarm business sector would have required approximately 2 million more persons to achieve the 2003 GDP levels. (4) Productivity is related to the concept of efficiency, yet productivity is defined by output relative to resources, and efficiency is the value of output relative to cost. As efficiency and productivity increase, whether by technology or process improvement, fewer workers are usually required.
As highlighted in the November 2006 issue of InContext, Indiana manufacturing productivity has been especially successful. The value added percent change in productivity per production worker increased by 30 percent from 1997 to 2002. Productivity and profit as measured by the economic census are increasing: during 2002 in Indiana, for every dollar paid to an Indiana production worker in wages, $3.41 of value added was generated. This is up from $3.04 in 1997, confirming that manufacturing is experiencing greater production with fewer workers. (5)
Hoosier workers have to compete with themselves, as well as the workforce of other states and other countries. Advances in technology and changes in the global economy increasingly impact domestic jobs. Only with increased skill development, education and training can we ensure a competitive Indiana workforce. Stay tuned for the next InContext article, which will go into additional detail about the movement of jobs to other states, along with an analysis of the skills our workforce will need to compete for the jobs that will be in demand in the future. Jobs are being lost here in Indiana, yet opportunities are opening daily in new industries, requiring new skills, and in many cases paying higher wages. Indiana continues to pursue attraction projects and plant expansions. Companies that have chosen to bring new jobs to Indiana include Honda, Toyota and WellPoint, which may bring over 4,000 jobs to Greensburg, Lafayette and Indianapolis. Yet we anticipate future employment growth to be dominated by the health care and social assistance industry, with over 80,000 new jobs projected between 2004 and 2014.
Notes
- For the purposes of this analysis, we examined permanent mass layoff events, those jobs that were lost and not anticipated to be recalled after 30 days. There are many more layoff events, initial claims and separations in which claimants are off work for more than 30 days, but in some cases they may still be called back to work. This analysis does not include layoffs where employees transfer, retire, become reemployed, have buy outs, or withdraw from the workforce, or layoffs where just a few employees leave each week gradually over a long period.
- Hoosiers by the Numbers (CES not seasonally adjusted annual data). Available at www.hoosierdata.in.gov.
- http://en.wikipedia.org/wiki/Nearshoring
- The Brookings Institution Policy Brief #136: Offshoring, Import Competition, and the Jobless Recovery, August 2004.
- Allison Leeuw and Jon Wright, “Measuring Worker Productivity: Comparing Indiana to Its Neighbors,” InContext, November 2006, 7(11).
Joseph Roesler and Allison Leeuw
Research and Analysis, Workforce Transitions, Indiana Department of Workforce Development
