Measuring Worker Productivity: Comparing Indiana to its Neighbors
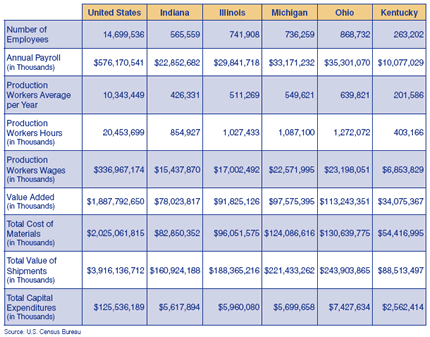
How does Indiana's manufacturing productivity compare to other states? To answer this question, the Advanced Economic and Market Analysis section of Indiana's Department of Workforce Development (AEMA) used the U.S. Census Bureau's 1997 and 2002 Economic Censuses, extracting the following data from the manufacturing reports: average number of employees (production and non-production combined), annual payroll, average number of production workers, production worker hours, production worker wages, value added, total cost of materials, total value of shipments and total capital expenditures (see Table 1). While the U.S. Bureau of Labor Statistics (BLS) defines labor productivity as output per hour of all employed, that productivity index is based on aggregate national measures and data sources that do not allow BLS to construct state measures.
Table 1: Worker Productivity in the Manufacturing Industry, 2002
Key Findings
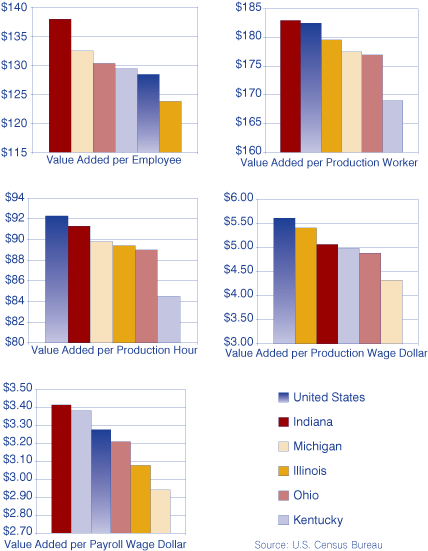
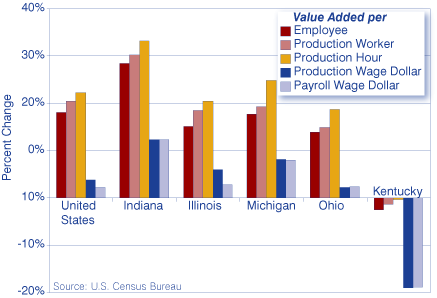
Five productivity measures (see Methodology) were created from the most recent economic census data (2002), and all five were compared to the previous economic census (1997) to measure the improvement or decline in productivity. For each of the measures, Indiana, Michigan, Ohio, Illinois and Kentucky were ranked amongst each other for 2002 (see Figure 1). Indiana ranked first in four of the five measures—the exception being “value added per production wage dollar.” Indiana ranked second on this measure behind Illinois. Each state was ranked according to its percent change in value added from 1997 to 2002. Indiana came out on top in all percentage increases of value-added measures (see Figure 2).
Figure 1: Value Added for Each Productivity Measure, 2002

Figure 2: Percent Change in Productivity, 1997 to 2002

Analysis
Despite job losses in manufacturing between 1997 and 2002, each state examined here (except Kentucky) has experienced increases in worker productivity over this five-year period. As shown in Figure 2, Indiana exhibits the greatest increases when compared to the nation and our four neighboring states. Most striking is the percent change for value added per production worker and per production hour. These productivity measures increased by 30 percent and 33 percent, respectively. This confirms that manufacturing is experiencing more output with less employment. These increases are due in no small part to increases in technology and skilled labor. Before we interpret this as bad news (for the worker who has lost his or her job), we have to recognize that higher skilled manufacturing jobs come with increased wages. In fact, hourly wage rates for production workers have increased by $1.25 on average since 1997. This data is not only promising for Indiana and the region, but it brings optimism to the manufacturing sector as a whole. Job losses are beginning to diminish (in fact, Indiana projects increases in manufacturing employment over the next decade), providing strong evidence that the manufacturing sector will continue to be a major economic driver for Indiana and the nation. The policy implications of this data once again support the notion that economic and workforce development initiatives will do well to focus on helping workers gain the skills they need to work more productively in an advancing manufacturing field. Indiana's Strategic Skills Initiative (SSI), which is working to address Indiana's critical job and skill shortages, is well timed. For more information on how Indiana's SSI and Training Acceleration Grants are committed to expanding the skills of Indiana's existing workforce and to increasing opportunities and wages for Hoosier workers, please visit www.in.gov/dwd.
Methodology
The Economic Census measures industry output with two calculations: value of shipments and value added. The value of shipments item covers the net selling values of all products shipped, as well as receipts for work contracted or performed for others. A multi-unit company that ships products, materials or contracts work between plants is requested to report the value of all products transferred. Due to this reporting duplication and the possible inaccuracies involved, the value-added measurement is considered to be the best value measure available for comparing the relative economic importance of manufacturing among industries and geographic areas. “The value-added measure of manufacturing activity is derived by subtracting the cost of materials, supplies, containers, fuel, purchased electricity, and contract work from the value of shipments (products manufactured plus receipts for services rendered).” For the purposes of this analysis, the value-added figures, therefore, appeared the best choice in comparing Indiana's manufacturing worker productivity to our neighboring states and the nation as a whole.
The five productivity measures (all expressed in dollar values) used were:
- Value added per employee (all employees)
- Value added per production worker
- Value added per production hour (hours worked by production workers)
- Value added per production wage dollar (wages paid to production workers)
- Value added per payroll wage dollar (wages paid to all employees)
As an example: for every dollar paid to an Indiana production worker in wages, $3.41 of value added is generated. The third measure (value added per production hour) most closely compares to the BLS definition of labor productivity at the national level.
Notes
- Economic Census Report for Indiana Manufacturing, 2002, Appendix A, 246–247.
Allison Leeuw and Jon Wright
Research and Analysis Department, Advanced Economic and Market Analysis Group, Indiana Department of Workforce Development

