Housing Unit Estimates for 2006
We all need a place to live and there are roughly 2,756,000 housing units in Indiana to help meet that need, according to the 2006 housing unit estimates from the U.S. Census Bureau. That amounts to 2 percent of the 126 million units nationwide.
Just so we're all on the same page, the Census Bureau defines a housing unit as a house, an apartment, a mobile home or trailer, a group of rooms, or a single room that is occupied (or intended for occupancy) as separate living quarters (i.e., occupants do not have to go through someone else's living quarters to get to their own unit). [1]
Short-Term Change
Indiana's housing stock grew 1.2 percent between July 1, 2005, and July 1, 2006. The United States as a whole had a slightly faster growth rate at 1.4 percent. Nevada led the nation on a percentage basis at 4.5 percent, while Florida had the largest numeric growth with the addition of 273,000 housing units. Not surprisingly, Louisiana was the only state to lose housing units, with a decline of 5.7 percent (or 110,000 units), primarily due to Hurricane Katrina.
As far as Indiana counties are concerned, it's all about the suburbs (see Table 1). Hamilton and Hendricks counties led the state with 2005-2006 growth of 4.5 and 4.4 percent, respectively. Warrick, Boone and Johnson counties round out the top five based on percent change. All of these surround Indianapolis, with the exception of Warrick, which is adjacent to Evansville. Meanwhile, 59 of the state's 92 counties came in under 1 percent.
Hamilton County led the state in the number of housing units added, building nearly 4,100 units in a single year.
Table 1: Top Ten for Percent Change
| County | July 2006 | Change, 2005 to 2006 | Percent Change, 2005 to 2006 |
| Indiana | 2,756,331 | 31,852 | 1.2 |
| Hamilton | 95,690 | 4,092 | 4.5 |
| Hendricks | 53,430 | 2,258 | 4.4 |
| Warrick | 23,783 | 811 | 3.5 |
| Boone | 21,277 | 695 | 3.4 |
| Johnson | 53,949 | 1,752 | 3.4 |
| Hancock | 26,947 | 698 | 2.7 |
| Switzerland | 5,064 | 121 | 2.4 |
| Porter | 64,621 | 1,271 | 2.0 |
| Clark | 46,845 | 865 | 1.9 |
| Jasper | 12,746 | 218 | 1.7 |
Change Since Census 2000
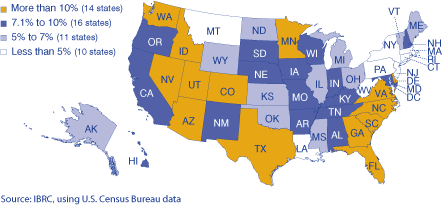
Taking a longer time frame into consideration, Indiana has increased its housing stock by 8.8 percent since Census 2000, slightly less than the national average of 9 percent. Indiana ranked 20th among the states on this measure (see Figure 1). Fourteen states had growth rates exceeding 10 percent, led by Nevada at nearly 29 percent. Based on the sheer number of housing units added, Florida and Texas top the list, each adding more than 1 million units since 2000.
Figure 1: Change in Housing Units by State, 2000 to 2006
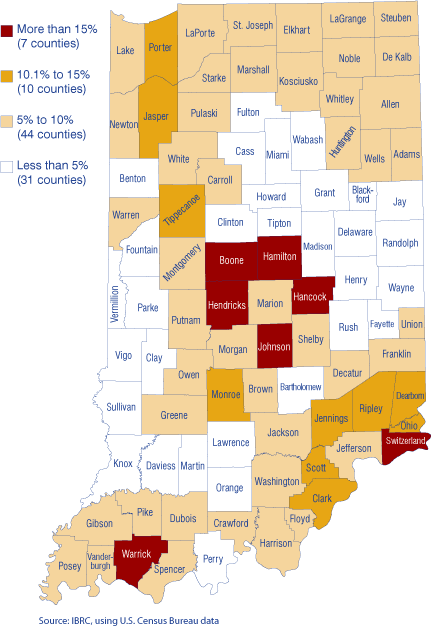
Since 2000, Indiana added 224,000 new housing units. Nearly a quarter of these units were added in just two counties—Marion and Hamilton. While 10 counties encountered tiny declines in the number of housing units during the 2005-2006 period, no county had a declining housing stock for the 2000-2006 time period. Looking at the rate of change, Hamilton and Hendricks counties again top the list, with 2000-2006 growth exceeding 36 percent (see Figure 2). Benton, Randolph and Wayne counties are at the other end of the spectrum, growing by just 2 percent.
Figure 2: Change in Housing Units by Indiana County, 2000 to 2006

Looking Ahead
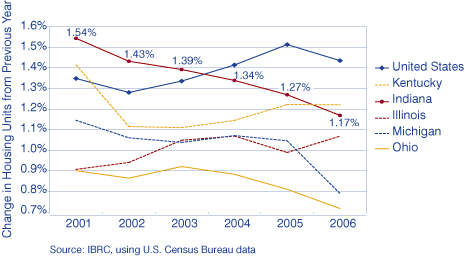
As seen in Figure 3, Indiana and its contiguous states have behaved quite differently from the nation over the past six years. Indiana has seen a steady, albeit small, decline in the rate of housing unit growth. The state started with a 1.5 percent growth between 2000 and 2001 and that dropped slightly each year, down to a 1.2 percent change between 2005 and 2006.
With the current turmoil in the housing market, it's likely that Indiana will continue to see fewer new housing units in the coming years.
Figure 3: Rate of Housing Unit Growth in Indiana and the Midwest, 2001 to 2006

Note
Rachel Justis
Managing Editor, Indiana Business Research Center, Kelley School of Business, Indiana University

