Midwest Business, Employment and Pay Landscape
In November, the biggest U.S. automaker, General Motors, announced it was cutting 9 percent of its global workforce and closing nine North American assembly, stamping and powertrain plants by 2008. This was sobering news for the entire Midwest and the rest of the nation. Before the GM plans had completely soaked in, Ford Motor Company announced a similar trimming of its workforce—a 20 to 25 percent reduction of its North American workforce by 2012. Change is in the air and only time will tell how this all plays out. But in the meantime, there are good data being produced that Indiana and the Midwest can use to better understand its economic foundations and assess its strengths and weaknesses.
The Bureau of Labor Statistics Quarterly Census of Employment and Wages recently released data for the second quarter of 2005. While a little dated, the dataset is more comprehensive than the monthly surveys (and the surveys use it to benchmark against).
Business Trends across the Midwest
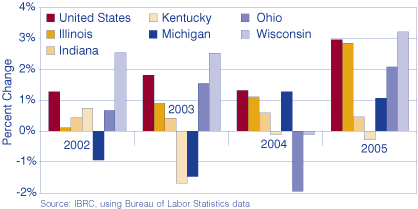
Since 2001, Indiana has added businesses each year, and in 2005, the addition of a little over 700 businesses brought the total close to 153,400. Over the four-year period, the state had a net increase of 2,250 businesses or 1.9 percent. Over this same time period, Michigan and Kentucky lost businesses, 169 and 1,438, respectively. Ohio had a 2.3 percent increase, while Illinois (5.1 percent increase) and Wisconsin (8.4 percent increase) were more in line with the nation's growth of 7.6 percent. Figure 1 looks at the over-the-year percent change in the number of businesses, showing that Indiana had growth rates below the nation for the four-year time period. Although Indiana's growth rate in 2005 was slower than most of its Midwestern neighbors, the state shares a positive distinction with Illinois for no net declines in businesses. Wisconsin, which is certainly one of Indiana's peers in terms of population, added 9,500 more businesses than Indiana and had a growth rate that was 6.5 percentage points greater than the state. Maybe this is indicative that Indiana's business environment needs improvement. Cfed, a Washington, D.C., nonprofit organization, gave Indiana's business climate grades of Cs and Ds, while Wisconsin's lowest grade was a B.
Figure 1: Over-the-Year Percent Change in Businesses, 2005:2
Employment Trends across the Midwest
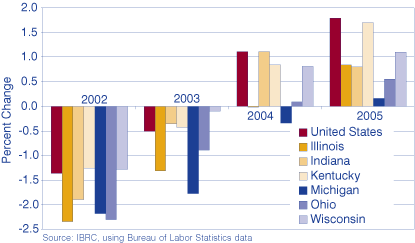
For a recession that didn't officially kick off until March 2001, according to the National Bureau of Economic Research, Figure 2 shows that Indiana and its Midwestern neighbors were still in the midst of job losses in the second quarter of 2002. Indiana suffered greater percentage declines during this timeframe but then pulled out of the recession a little quicker than the rest of the nation. In 2004, Indiana saw a 1.1 percent expansion in jobs—tying with the nation. However, the state lost ground in 2005 with an employment growth rate that was 1 percentage point below the nation.
Figure 2: Over-the-Year Percent Change in Employment, 2005:2
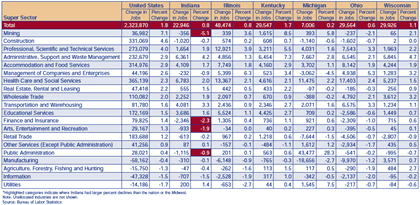
According to Table 1, Indiana gained almost 23,000 jobs over the year. Ohio, Wisconsin and Kentucky all gained about 29,000 jobs each, while Illinois gained more than twice as many jobs as Indiana. Michigan stood alone with only 7,000 jobs added, suffering heavy losses in its manufacturing industries. In fact, Indiana fared the best in manufacturing with only 300 lost jobs or -0.1 percent. Nine of Indiana's sectors experienced job losses. Comparatively, Ohio lost jobs in 13 sectors and Kentucky only saw losses in two. Indiana saw larger percentage declines than the rest of the Midwest and the nation in mining, finance and insurance, arts, entertainment and recreation, and public administration.
Table 1: Over-the-Year Job Change
Although overall job gains are good, it may not be a healthy scenario when the majority of the gain is reliant on 10 of the 20 sectors making up the state's economy and five sectors in particular. Transportation and warehousing, administrative support, education, health care and social services, and accommodation and food services contributed 85 percent of the total number of jobs gained. Within the Midwest, only Ohio had a more uneven pattern of employment growth. The Federal Deposit Insurance Corp. (FDIC) found similar results for the third quarter of 2005. The report found that, for many Hoosiers, "A combination of relatively slow population growth, steady housing starts, uneven employment conditions and slow income growth ... produced conditions for added financial stress."
Industrial Mix of Jobs
Over the course of a year, the state's job composition has changed. There has been a shift away from manufacturing (20 percent to 19.8 percent of jobs), construction, retail, finance and insurance, and public administration jobs. Meanwhile, other sectors of the economy, such as transportation and warehousing, administrative support, education, health care and social services, and accommodation and food services (the same five sectors mentioned above), have picked up and boosted their shares of total employment.
Pay Levels for Indiana and the Nation
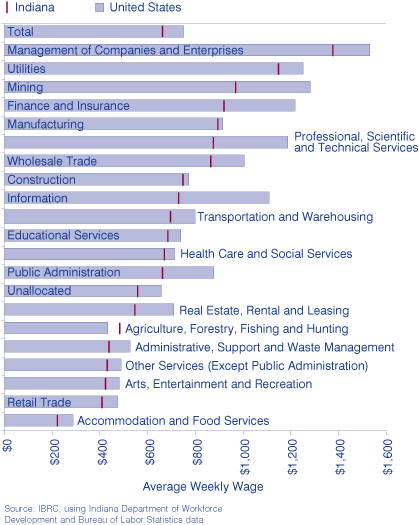
Figure 3 illustrates a pay gap between Indiana and the nation for all industries. The average Hoosier brings home $664 dollars a week—$87 dollars less than others across the nation. The only industry paying Hoosiers more is agriculture, fishing and hunting where Hoosiers earn $484 a week—$52 dollars more than the U.S. average. The gap continues to widen as the country's average weekly wage advanced 3.8 percent—a full percentage point above the state. Only five industries in Indiana outpaced the nation's growth rate: management of companies and enterprises, mining, education services, professional and technical services, and public administration.
Figure 3: Average Weekly Wages in Indiana and the United States
The Languid Manufacturing Sector
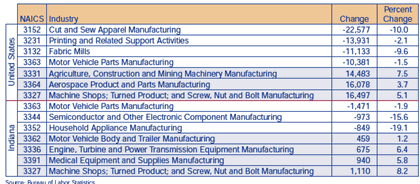
The manufacturing environment in Indiana and the rest of the nation is changing due to global competition, process improvements and increased productivity. Table 2 looks at which manufacturing industries had the largest numeric increases and decreases in jobs in the United States and Indiana. Both Indiana and the nation experienced a decline in motor vehicle parts manufacturing but Indiana sustained a slightly greater percentage decline. The manufacturing industry with the largest job increase in the state was machine shops; turned product; and screw, nut and bolt manufacturing with 1,100 jobs added or 8.2 percent. This was also the fastest growing at the national level, although Indiana added jobs at a faster rate.
Table 2: Largest Over-the-Year Numeric Change in Manufacturing
Indiana has 585 businesses and 127,300 employees working in the manufacturing of automobiles and vehicle parts. That constitutes over one-fifth of all manufacturing jobs in the state or 14.4 percentage points greater than the number of jobs the United States has devoted to the automobile industry (as a share of all manufacturing jobs). Only Michigan, where the automobile industry constitutes a little more than one-third of all manufacturing jobs, has more vested than Indiana in this industry.
Notes
- Associated Press, "GM Slashing 30,000 Jobs, Closing Plants," MSNBC Online, November 21, 2005.
- Associated Press, "Ford to Cut up to 30,000 Jobs, Idle 14 Plants," MSNBC Online, January 23, 2006.
- http://scorecard.assetsandopportunity.org/2012/state/in; and Norm Heikens, "Indiana's Economic Grades Falling," Indystar.com, January 28, 2006.
- Bill Medley, "Hoosiers Feeling Economic Pinch, Says FDIC Report," Evansville Courier and Press, January 11, 2006. Available at www.indianaeconomicdigest.net/main.asp?SectionID=31&SubSectionID=116&ArticleID=24081; and www.fdic.gov/bank/analytical/stateprofile/Chicago/In/IN.xml.html
Amber Kostelac, Data Manager
Indiana Business Research
Center, Kelley School of Business, Indiana University

