Monthly Metrics: Indiana's Economic Indicators
Mass Layoffs, 1996 to 2005
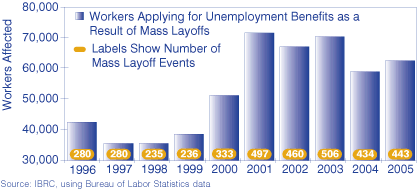
Slightly more Hoosiers were impacted in 2005 by mass layoffs than in 2004, according to preliminary figures from the Bureau of Labor Statistics. A mass layoff occurs when at least 50 initial claims for unemployment insurance are filed against an establishment during a consecutive five-week period. Over 440 mass layoff events were recorded in 2005, with 62,574 people applying for unemployment benefits as a result—an increase of 6.3 percent from 2004. However, this compares to an 11.7 percent increase in claimants nationwide.
Total Average Compensation per Job, 2001 to 2004
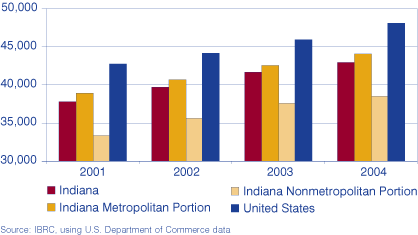
Indiana's average compensation per job increased to $42,964 in 2004. Compensation figures include wages plus benefits, such as employer-paid pension and insurance funds. Not surprisingly, compensation in Indiana's metro areas ($44,036) is higher than in the nonmetro areas ($38,475), while both measures lag the U.S. average ($48,096).
Indiana's Exports to the World
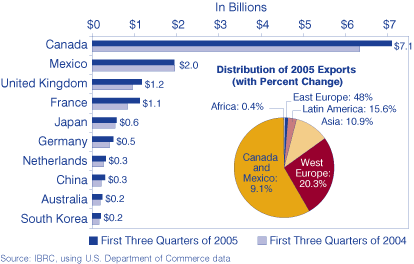
Indiana exported $16 billion worth of products to 187 countries during the first three quarters of 2005, a 12.7 percent increase ($1.8 billion) over the first three quarters in 2004. While exports more than doubled in 35 of our smaller trading partners, over 70 percent of Indiana exports go to just four countries (Canada, Mexico, the United Kingdom and France), each receiving over $1 billion in exports.
Members of Unions, 2005
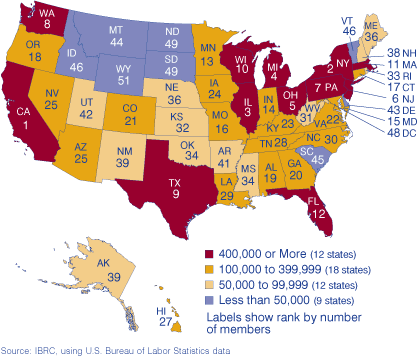
Indiana's union membership totaled 346,000 workers in 2005, or 12.4 percent of the workforce. An additional 22,000 workers were represented by a union but were not members. Nationwide, public sector employees are more than four times more likely to be unionized than the private sector. Local government workers (which include teachers, police and firefighters) had the highest membership rate (41.9 percent). Transportation and utilities (24 percent), information industries (13.6 percent), construction (13.1 percent) and manufacturing (13 percent) led the private sector in union membership rates.
Exports from Indiana, First Three Quarters of 2005
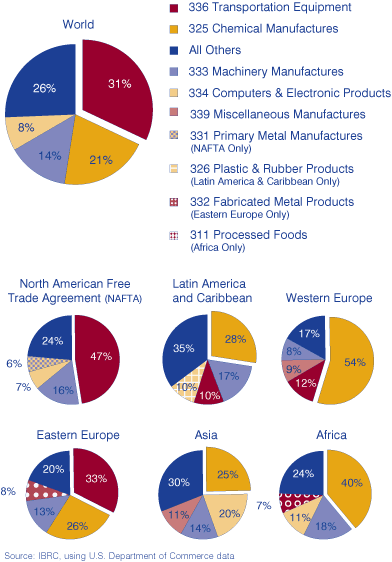
Over half of Indiana's exports are either transportation equipment (31 percent) or chemical products (21 percent). (1) Exports vary significantly by region, with transportation equipment consisting of nearly half Indiana's exports to NAFTA partners and chemical products exceeding 50 percent of Indiana's exports to Western Europe. Overall, transportation equipment accounts for $5.1 billion of Hoosier exports, as of the first three quarters of 2005 and has grown 8 percent since 2004; meanwhile, chemical product exports grew a strong 22 percent to reach $3.3 billion.
Notes
- The transportation equipment classification includes vehicles and vehicle parts; chemical manufacturing includes a wide variety of products, from pharmaceuticals to paint to pesticide.
