Economic Growth Region 2: North-Central Indiana
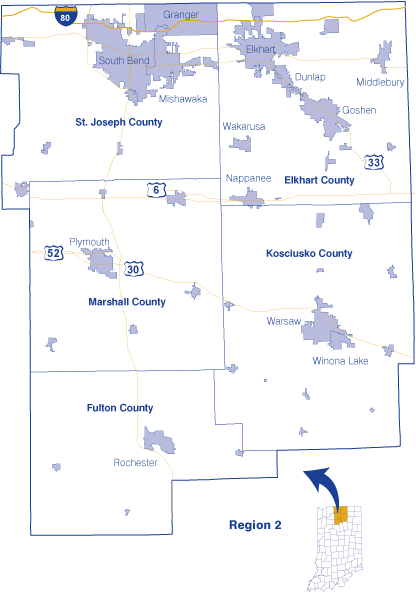
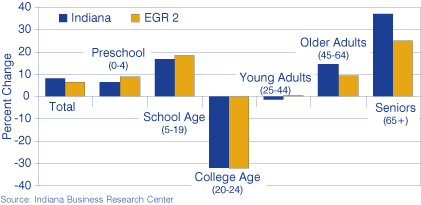
Economic Growth Region 2 (EGR 2) includes Elkhart, Fulton, Kosciusko, Marshall and St. Joseph counties. With over 2,270 square miles of land, the five-county region is home to about 601,000 people, or 9.6 percent of Indiana's total population. South Bend in St. Joseph County is the largest city in the region, with more than 105,000 people. Over 76 percent of the region's population resides in Elkhart and St. Joseph counties. Compared to Indiana, EGR 2 has not kept up with the population growth rate. From 2000 to 2004, Indiana's population increased by 2.4 percent, while EGR 2 increased by 2 percent. Figure 1 shows the expected change in population for each age group from 2004 to 2020.
Figure 1: Percent Change in Population by Age, 2004 to 2020
Jobs
Region 2 mirrors the state exactly in terms of the top five industries with the most employees:
- Manufacturing
- Health care and social services
- Retail trade
- Educational services
- Accommodation and food services
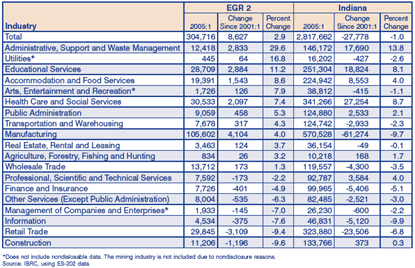
While retail trade ranked third for employment in 2005, it experienced job losses in both EGR 2 (a 9.4 percent decline) and the state (a 6.8 percent decline). Retail trade lost the most jobs from the first quarter of 2001 to the same time in 2005 at the regional level and was second only to job losses in manufacturing at the state level.
The five-county region seems to be holding its weight in the manufacturing industry. In 2004, manufacturing made up 34.7 percent of all jobs in the region; compare that to only 20.2 percent for the state. On a similar note, the state lost over 61,000 jobs (a 9.7 percent decline) from 2001 to 2005 in the manufacturing industry, while EGR 2 added about 4,100 jobs (a 4 percent increase). This difference between Region 2 and the state could increase with the opening of a new Keystone plant (RV manufacturer) in Elkhart County. It is expected to bring about 300 jobs to the area in the coming year.1 As shown in Table 1, EGR 2 fared better than the state overall in terms of change in jobs, adding 8,627 (a 2.9 percent increase), while the state lost 27,778 (a 1 percent decrease).
Table 1: Change in Jobs in EGR 2 and Indiana, 2001:1 to 2005:1
Income and Wages
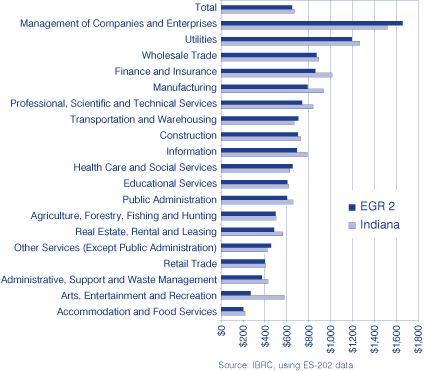
While EGR 2 has increased wages at a faster rate than the state from the first quarter of 2001 to the first quarter of 2005, it has not managed to catch up to Indiana's average weekly wage across all industries ($667). Region 2 wages increased by $65 but remained $19 shy of breaking even with Indiana's average.
The management of companies and enterprises industry paid the most in average weekly wages for the first quarter of 2005 both in EGR 2 and Indiana (see Figure 2). While Region 2 increased wages paid in this industry by $128, Indiana decreased the wages paid by $142 (an 8.6 percent decline from its 2001 level), creating the largest difference in pay where EGR 2 paid more than the state. On the other hand, Indiana paid $308 more per week for employees in the arts, entertainment and recreation industry. These dramatic differences are offset by the fact that both industries combined made up only 1.2 percent of jobs in Region 2 and 2.3 percent of jobs in Indiana.
Figure 2: Average Weekly Wage in Indiana and EGR 2, 2005:1
Unemployment
Indiana's unemployment rate in October 2005 was higher than both EGR 2 and the nation by 0.4 percentage points. For the past 13 years, EGR 2 has maintained an unemployment rate below both the nation and the state, with the exceptions of 1997, 2000 and 2001 when it remained below the nation but was higher than the state.
Building Permits
EGR 2 is not issuing building permits nearly as much as the state. From 1990 to 2004, EGR 2 increased the number of building permits issued by 8.7 percent (up to 3,044 units) while the state added 58.1 percent (just over 39,000 units). As a percent of the state total, EGR 2 makes up only 7.7 percent of all building permits, which could help explain the nearly 1,200 loss in jobs in the construction industry shown in Table 1. Similarly, in the 14-year period, the cost for Indiana building permits has increased 177.9 percent, while the region's costs have increased 108.1 percent. Of the building permits issued, the majority for both EGR 2 (88 percent) and Indiana (82 percent) were for single-family units.
Commuting
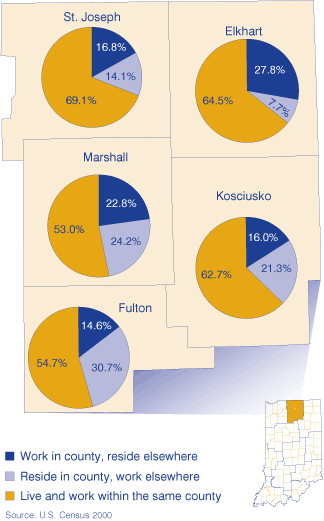
More than 325,000 workers either reside in or commute to EGR 2, according to Census 2000. Of those, 87 percent reside and work within the region, while another 13 percent live outside the region but commute into it. Not surprisingly, of all those working in Region 2, 79.5 percent worked in either St. Joseph or Elkhart County. At the same time, Fulton and Marshall counties only had a combined 29,446 people (9.5 percent of all workers working in the region). Of all those living in the region and working anywhere, only 5.3 percent leave the region to work.
Figure 3: EGR 2 Commuting Patterns
Notes
- Marilyn Odendahl, “More RV Jobs on the Way to Elkhart County,” Truth Publishing 10 December 2005.
Molly Marlatt, Research Associate
Indiana Business Research
Center, Kelley School of Business, Indiana University

