Inside the Data Center
Minority Buying Power
A recent report from the University of Georgia's Selig Center for Economic Growth shows that the buying power of U.S. consumers, including that of African-Americans, Asians, Native Americans and Hispanics will continue to have substantial gains. Buying power is total personal income available after taxes, not including money that was borrowed or saved in previous years. It does not measure wealth and does not include spending by tourists.
Data from the report, The Multicultural Economy 2005: America's Minority Buying Power, shows that the buying power of both the African-American and Hispanic populations in the United States is already larger than the GDP (in dollars) of all but nine countries in the world. By 2010, the size of both those markets could surpass the GDP of Canada, the world's ninth largest economy.
In Indiana, the African-American market is larger than the economies of countries like Jordan and Jamaica. By 2010, it could exceed the GDPs of Latvia and Iceland. The Hispanic market in Indiana is greater than the economies of Mali and Armenia and could surpass those of Uganda and Nepal by 2010.
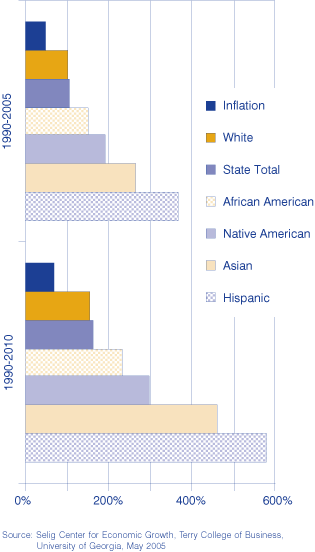
The Selig Center projects that Indiana's total buying power will increase from $85.4 billion in 1990 to $177.5 billion in 2005, and to $225.5 billion in 2010 (see Table 1). The growth rate for 1990–2010 is 164 percent, much greater than the 68 percent increase in the U.S. consumer price index (CPI) for all urban consumers for the same period. From 1990 to 2005, total buying power in Indiana will have risen by 108 percent while the CPI will have risen by 48.9 percent (see Figure 1). Between 2000 and 2005, total buying power will have grown 23 percent (CPI growth of 13.1 percent). Between 2005 and 2010, it will grow 27 percent (CPI growth of 12.6 percent).
Table 1: Indiana's Total Buying Power (Thousands of Dollars)

Figure 1: Buying Power Growth, Indiana

State of the Cities Data Systems (SOCDS)
With data from the Census Bureau, Bureau of Labor Statistics and Federal Bureau of Investigation, the SOCDS provides users with data for individual metropolitan areas, central cities and suburbs:
- Detailed demographic and economic characteristics from the 1970, 1980, 1990 and 2000 censuses.
- Unemployment rate and labor force data from 1990 to 2005.
- Jobs, business establishments and average pay from county business patterns since 1992.
- Violent and property crime rates from 1992 to 2002.
- Residential construction permit data on an annual basis from 1980 and monthly since 1997.
- Public finance data from 1992, 1997 and 2002.
- Comprehensive Housing Affordability Strategy (CHAS) data, showing housing problems and the availability of affordable housing.
To learn more about the SOCDS and to download data, visit https://www.huduser.gov/portal/datasets/socds.html.
More ACS Data Released
In November 2005, the Census Bureau released over 600 additional tables from the 2004 American Community Survey (ACS). The ACS contains estimates for the state of Indiana; Allen, Lake, Marion and St. Joseph counties; the Fort Wayne, Indianapolis and South Bend metro areas; the City of Indianapolis; and Congressional District 7.
The Census Bureau also released new subject tables, similar to the Census 2000 quick tables. The subject tables show percent distributions rather than just the estimates. They also allow for other measures like medians and means when appropriate and include imputation rates for some measures. Subject tables were issued in 42 subjects, including education, employment, poverty, income, language and housing. The additional data may be found at http://factfinder.census.gov.
Frank Wilmot, State Data Center Coordinator
Indiana State Library
