Monthly Metrics: Indiana's Economic Indicators
Indiana Manufacturing Industries Value Added as a Percent of Total Manufacturing Value Added, 2004
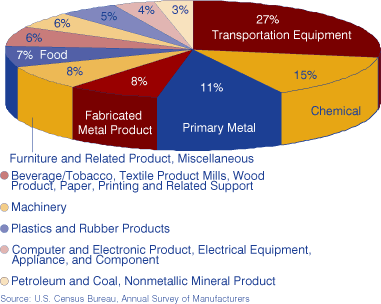
Value-added (1) is considered to be the best measure available for comparing the relative economic importance of manufacturing among industries and geographic areas. From 1997 to 2004, Indiana's value-added to manufacturing increased at a rate almost triple that of the United States. In 2004, the industries that contributed the most to value-added in manufacturing in the state were transportation equipment manufacturing (27 percent), chemical manufacturing (15 percent) and primary metal manufacturing (11 percent).
- Value-added is derived by subtracting the cost of materials, supplies, containers, fuel, purchased electricity and contract work from the value of shipments and adjusting by the addition of value added by merchandising operations and plus the net change in finished goods and work-in-process between the beginning- and end-of-year inventories.
Hispanic-Owned Businesses, 2002
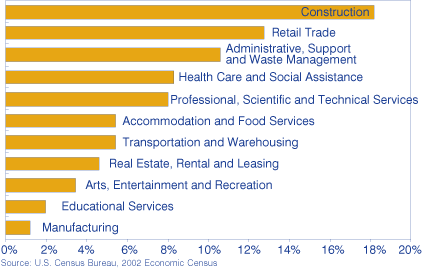
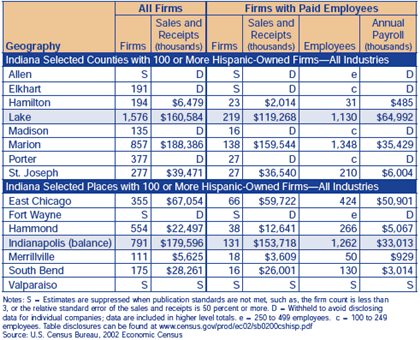
Hispanic-owned businesses only made up 1.3 percent of all businesses in Indiana in 2002. The vast majority of Hispanic-owned firms (84 percent) had no paid employees and were self-employed; however, the vast majority of sales came from Hispanic-owned firms with paid employees (82 percent). In Indiana, the industries with the most Hispanic-owned businesses were construction, retail trade, and administrative, support and waste management. This was similar to the U.S. composition, except retail trade was the second largest industry for Hispanic businesses in Indiana, while it ranked fifth nationwide. Eight counties, mostly in the northern and central parts of the state, comprised 66 percent of all Hispanic-owned businesses. Lake County alone constitutes almost a third of all Hispanic-owned businesses in the state. Among Indiana cities, Indianapolis boasted the largest number of Hispanic businesses.
Bachelor's Degree Holders as a Percent of the Workforce, 2004
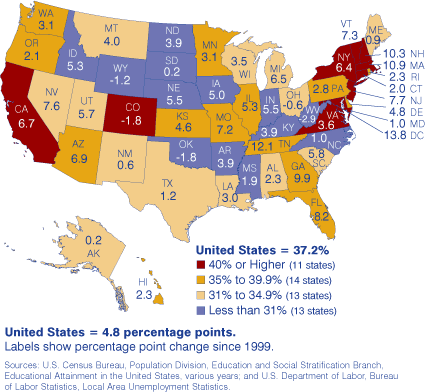
In 2004, 28.2 percent of Indiana's workforce held a bachelor's degree or higher. This was significantly lower than the U.S. average of 37.2 percent. Only three states had a lower share than Indiana in 2004. However, since 1999, Indiana has increased its share by 5.5 percentage points, whereas the United States only added 4.8 percentage points. Over a 10‑year time horizon, Indiana also increased its share by more than the nation, 10.1 percent and 7.7 percent, respectively.
Percent of Family Income Needed to Pay for College at Public, Four-Year Institutions, 2004
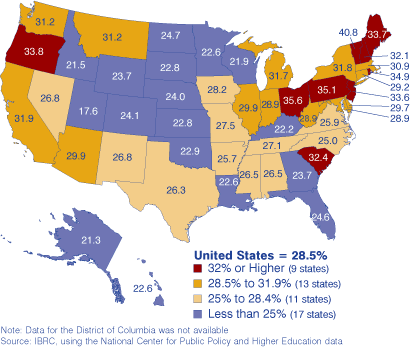
A college education isn't as affordable as it used to be. In 1999, room, board and tuition minus financial aid for a college education at a four-year, public university consumed 26.3 percent of family income across the nation. In 2004, that figure rose to 28.5 percent. Similarly, Indiana's percentages rose from 25.6 percent to 28.9 percent, ranking 20th in the nation. In 1999, a four-year college education at a public university was more affordable for Hoosiers than the average U.S. family; but by 2004, Indiana families found it less affordable than in the nation as a whole. When looking at various income levels, costs vary dramatically. For Indiana, college costs minus aid equated to 66.4 percent of income for those in the lowest quintile. For those in the highest quintile, it was just 9.1 percent.
